How to add custom EXIF data to a matplotlib plot using PIL/Pillow
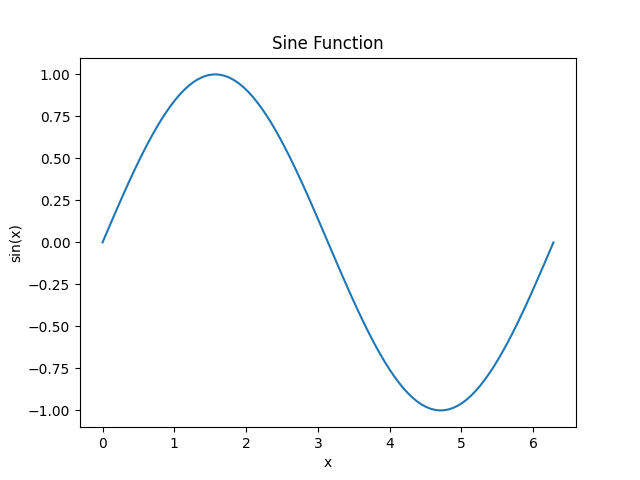
The following script is an example of how to use PIL/Pillow to add custom EXIF data to a matplotlib plot exported to PNG.
The intermediary IO is handled via a BytesIO to avoid having to write temporary files.
add_exif.py
import numpy as np
import matplotlib.pyplot as plt
from io import BytesIO
from PIL import Image

# Step 1: Plot a sine function using Matplotlib
x = np.linspace(0, 2 * np.pi, 100)
y = np.sin(x)

plt.figure()
plt.plot(x, y)
plt.title('Sine Function')
plt.xlabel('x')
plt.ylabel('sin(x)')

# Step 2: Save the plot to a BytesIO object
buf = BytesIO()
plt.savefig(buf, format='png')
plt.close()

# Step 3: Add custom EXIF data to the PNG file
buf.seek(0)
image = Image.open(buf)

# Convert the image to RGB (EXIF data is not supported on 'P' mode images)
image = image.convert('RGB')

# Create a dictionary to hold EXIF data
exif_dict = {
    0x9003: '2024:08:04 12:00:00',  # DateTimeOriginal
    0x010E: 'Sine Wave Plot',        # ImageDescription
    0x0131: 'Matplotlib',            # Software
}

# Convert the EXIF dictionary to bytes
exif_bytes = Image.Exif()
for tag, value in exif_dict.items():
    exif_bytes[tag] = value

# Step 4: Save the modified image with EXIF data to a new BytesIO object
output_buf = BytesIO()
image.save(output_buf, format='png', exif=exif_bytes)
output_buf.seek(0)

# Optionally, save the image to a file to verify
with open('sine_plot_with_exif.png', 'wb') as f:
f.write(output_buf.getvalue())Resulting plot

How to print the resulting EXIF data
You can use any EXIF tool to read the data, such as exiftool:
example.sh
exiftool sine_plot_with_exif.pngExample output:
example.txt
ExifTool Version Number         : 12.40
File Name                       : sine_plot_with_exif.png
File Size                       : 12345 bytes
File Modification Date/Time     : 2024:08:04 12:00:00+00:00
...
Image Description               : Sine Wave Plot
Date/Time Original              : 2024:08:04 12:00:00
Software                        : Matplotlib
...Check out similar posts by category:
Python, Matplotlib
If this post helped you, please consider buying me a coffee or donating via PayPal to support research & publishing of new posts on TechOverflow