
ROOT minimal TGraph plot example
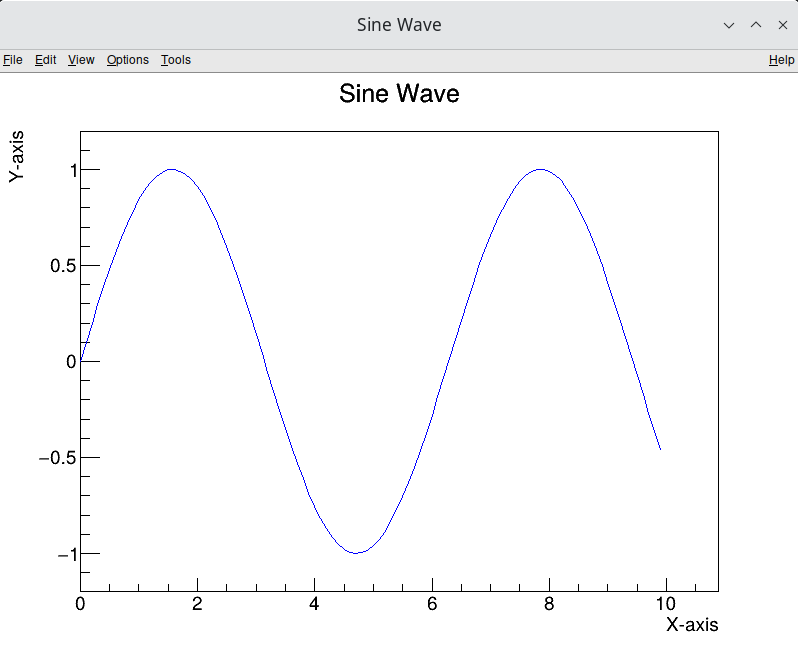
This is a minimal example of how to plot TGraph in ROOT. It plots a sine wave.
sine_wave.cpp
#include <TGraph.h>
#include <TCanvas.h>
#include <TAxis.h>
#include <TApplication.h>
#include <cmath>
#include <memory>  // For std::make_unique

int main(int argc, char **argv) {
    TApplication app("app", &argc, argv);

    // Number of points
    const int nPoints = 100;
    double x[nPoints], y[nPoints];

    // Fill arrays with x and y values (sine wave)
    for (int i = 0; i < nPoints; ++i) {
        x[i] = i * 0.1;            // x values
        y[i] = sin(x[i]);           // y values (sine of x)
    }

    // Use std::make_unique to create a unique_ptr for TCanvas and TGraph
    auto canvas = std::make_unique<TCanvas>("canvas", "Sine Wave", 800, 600);
    auto graph = std::make_unique<TGraph>(nPoints, x, y);

    // Set title and axis labels
    graph->SetTitle("Sine Wave;X-axis;Y-axis");
    graph->SetLineColor(kBlue);  // Set line color

    // Draw the graph
    graph->Draw("AL");  // "A" for axis, "L" for line

    // Run the application to display the plot
    app.Run();

    return 0;
}Compile using
example.sh
g++ -o sine_wave sine_wave.cpp `root-config --cflags --glibs`If this post helped you, please consider buying me a coffee or donating via PayPal to support research & publishing of new posts on TechOverflow