
PlotJuggler - ZMQ - Python minimal data source example
The following example serves as a starting point of how to develop a custom data source for PlotJuggler using Python and ZeroMQ.
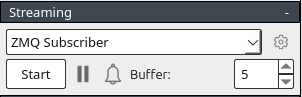
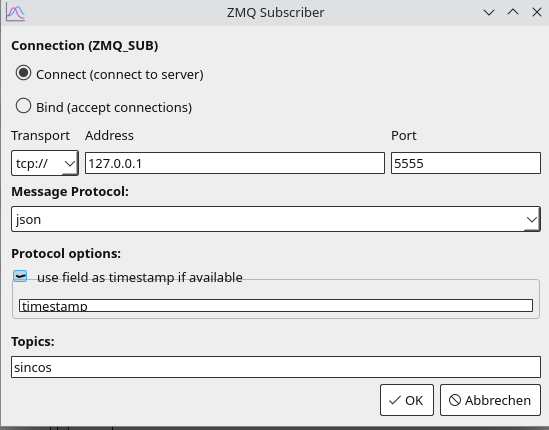
In order to use it, configure PlotJuggler like this
plotjuggler_zmq_producer.py
import zmq
import time
import json
import math

# ZeroMQ setup
context = zmq.Context()
socket = context.socket(zmq.PUB)
socket.bind("tcp://*:5555")  # Bind to a port PlotJuggler will connect to

# Generate and send data
time_start = time.time()
try:
    while True:
        elapsed_time = time.time() - time_start
        value = {
            "timestamp": elapsed_time,  # Zeit in Sekunden seit Scriptstart
            "variables": {
                "sin": math.sin(elapsed_time),  # Sinuswelle
                "cos": math.cos(elapsed_time),  # Kosinuswelle
            },
        }

        # Sende Daten als JSON mit dem Thema "sincos"
        socket.send_string("sincos", zmq.SNDMORE)
        socket.send_string(json.dumps(value))
        time.sleep(0.01)  # 100 Hz Update-Rate
except KeyboardInterrupt:
    print("Datenstrom unterbrochen.")
finally:
    socket.close()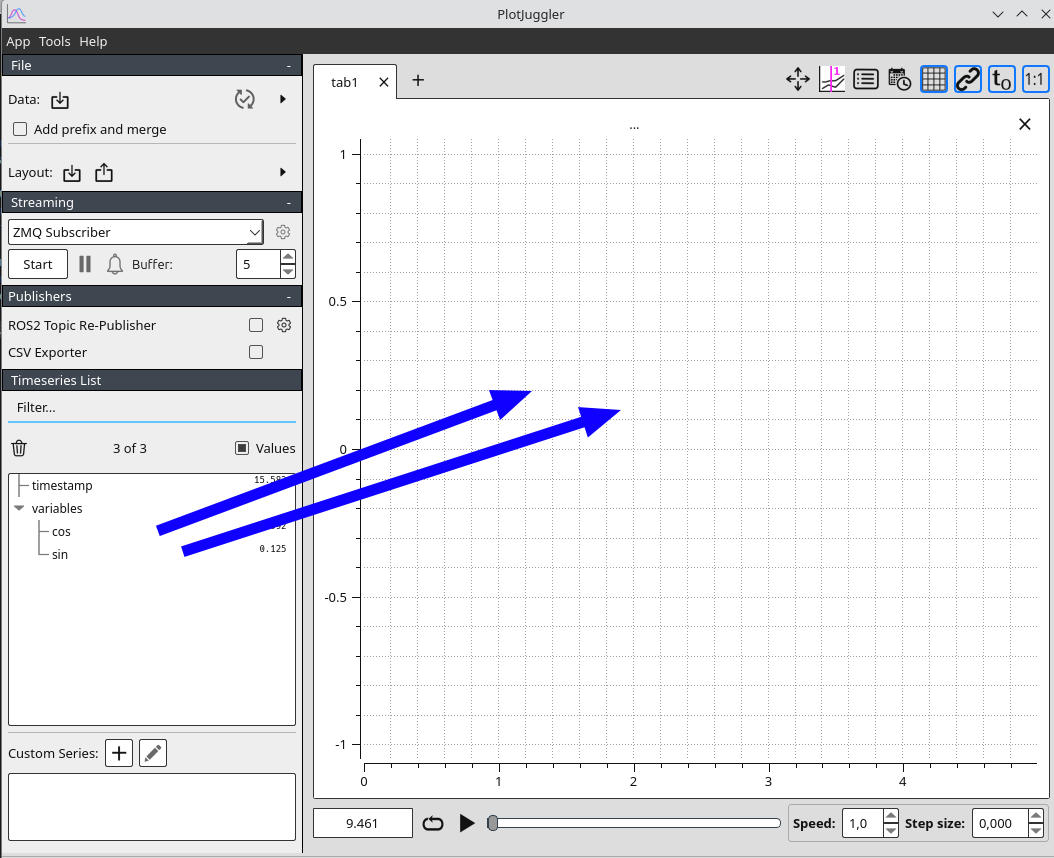
context.term()Now click Start in the streaming tab and don’t forget to drag the sin and cos variables to the plot.
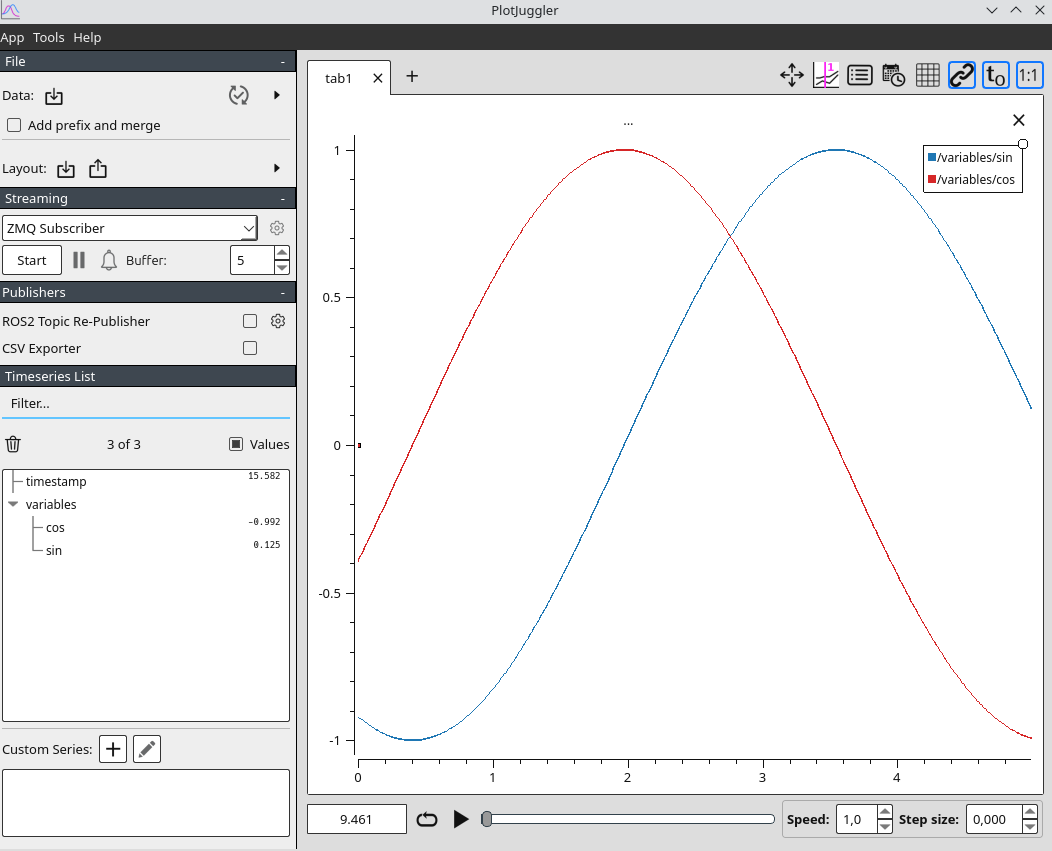
Output example
If this post helped you, please consider buying me a coffee or donating via PayPal to support research & publishing of new posts on TechOverflow