
How to compute capacitor charge/discharge time through a resistor using Python
You can easily compute the time it takes to charge or discharge a capacitor through a resistor using the UliEngineering Python library:
from UliEngineering.Electronics.Capacitors import *
from UliEngineering.EngineerIO import *

# Compute the charge time of a 100uF capacitor through 10k from a 5V source
# through a Schottky diode with 0.3V forward voltage, up to 3.0V
charge_time = capacitor_resistor_charge_time(
    capacitance="100uF", resistance="10kΩ", source_voltage="5V",
    initial_voltage="0V", target_voltage="3.0V", diode_voltage="300mV"
)

# Compute the discharge time of the same capacitor through 10k to 1.0V
# through a silicon diode with 0.7V forward voltage
discharge_time = capacitor_resistor_discharge_time(
    capacitance="100uF", resistance="10kΩ", initial_voltage="5.0V",
    target_voltage="1.0V", diode_voltage="700mV"
)

# Auto-format & print the results
print(f"Charge time: {format_value(charge_time, 's')}")
print(f"Discharge time: {format_value(discharge_time, 's')}")Example output
Charge time: 1.02 s
Discharge time: 2.66 s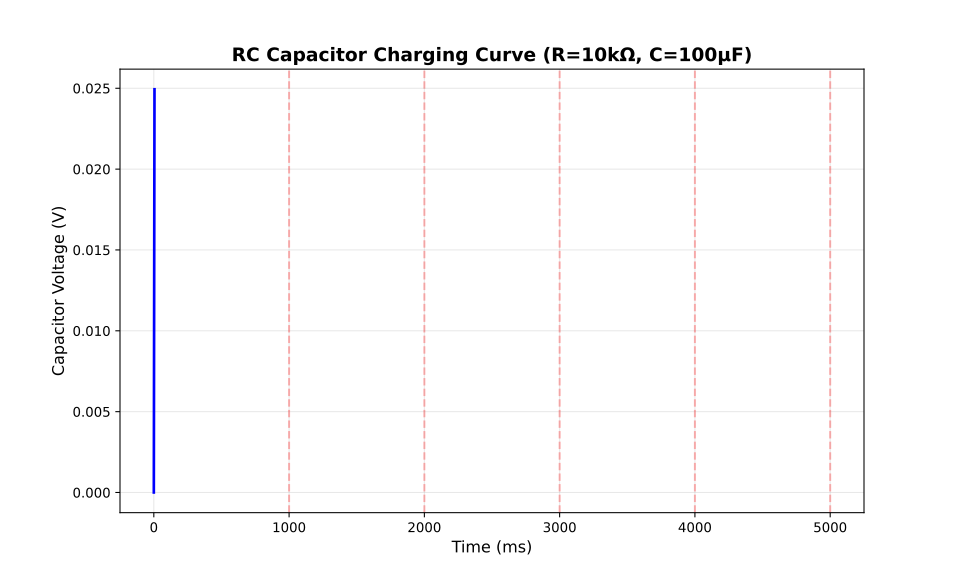
The charging and discharging of a capacitor through a resistor follows an exponential curve described by the RC time constant τ = R × C. The time constant determines how quickly the capacitor charges or discharges: after one time constant, the capacitor reaches approximately 63.2% of its final voltage during charging, or decays to 36.8% during discharging.
The plot above shows the characteristic RC charging curve for a 100 µF capacitor charging through a 10 kΩ resistor from a 5V source. The red dashed lines mark the time constants (τ, 2τ, 3τ, 4τ, 5τ), showing that the capacitor reaches 99.3% of the source voltage after 5 time constants. This demonstrates why the time constant is fundamental to timing circuits, filters, and pulse shaping applications.
Plot generation script
#!/usr/bin/env python3
import matplotlib.pyplot as plt
import numpy as np
import sys
sys.path.insert(0, '/home/uli/dev/UliEngineering')

from UliEngineering.Electronics.Capacitors import capacitor_resistor_charge_time

# Time range for plotting
t = np.linspace(0, 0.005, 200)  # 0 to 5ms

# Create plot
plt.figure(figsize=(10, 6))

# Fixed parameters
C = 100e-6  # 100 µF
R = 10e3  # 10 kΩ
V_source = 5.0  # 5V
V_initial = 0.0

# Calculate voltage vs time for RC charging
tau = R * C
V = V_source + (V_initial - V_source) * np.exp(-t / tau)

plt.plot(t * 1000, V, color='blue', linewidth=2)
plt.xlabel('Time (ms)', fontsize=12)
plt.ylabel('Capacitor Voltage (V)', fontsize=12)
plt.title('RC Capacitor Charging Curve (R=10kΩ, C=100µF)', fontsize=14, fontweight='bold')
plt.grid(True, alpha=0.3)

# Mark time constants
for n in [1, 2, 3, 4, 5]:
    t_n = n * tau
    V_n = V_source + (V_initial - V_source) * np.exp(-n)
    plt.axvline(x=t_n * 1000, color='red', linestyle='--', alpha=0.3)
    plt.text(t_n * 1000, V_n + 0.1, f'{n}τ', fontsize=9, color='red')

plt.tight_layout()
plt.savefig('capacitor_charge_time_plot.svg', format='svg', dpi=300)