Python

How to always get latest frame from OpenCV VideoCapture in Python

When working with OpenCV video capture, but when you only occasionally use images, you will get older images from the capture buffer.

This code example solves this issue by running a separate capture thread that continually saves images to a temporary buffer.

Therefore, you can always get the latest image from the buffer. The code is based on our basic example How to take a webcam picture using OpenCV in Python

video_capture = cv2.VideoCapture(0)

video_capture.set(cv2.CAP_PROP_FRAME_WIDTH, 1920)
video_capture.set(cv2.CAP_PROP_FRAME_HEIGHT, 1080)

if not video_capture.isOpened():
    raise Exception("Could not open video device")

class TakeCameraLatestPictureThread(threading.Thread):
    def __init__(self, camera):
        self.camera = camera
        self.frame = None
        super().__init__()
        # Start thread
        self.start()

    def run(self):
        while True:
            ret, self.frame = self.camera.read()

latest_picture = TakeCameraLatestPictureThread(video_capture)

Usage example:

# Convert latest image to the correct colorspace
rgb_img = cv2.cvtColor(latest_picture.frame, cv2.COLOR_BGR2RGB)
# Show
plt.imshow(rgb_img)


Posted by Uli Köhler in Audio/Video, OpenCV, Python

How to turn DL3021 off via SCPI/LXI

In order to turn off the DL3021 electronic load (as in: disable any constant current/resistance/voltage/power function) via LXI, run the following command:

:SOURCE:INPUT:STATE Off

PyVISA example

For more info, see PyVISA Rigol DL3021 via LXI (TCP SCPI) example

#!/usr/bin/env python3

rm = pyvisa.ResourceManager()
inst = rm.open_resource("TCPIP0::192.168.178.112::INSTR")
# Query if instrument is present
# Prints e.g. "RIGOL TECHNOLOGIES,DL3021,DL3A204800938,00.01.05.00.01"
print(inst.query("*IDN?"))

# Turn electronic load off
inst.write(":SOURCE:INPUT:STATE Off")


Posted by Uli Köhler in Analog, Electronics, Networking, Python

A Python SLIP decoder using serial_asyncio

The following Python script receives SLIP-encoded data from a serial port (/dev/ttyACM0 in this example) and decodes the SLIP messages using the fully asynchronous (asyncio-based) serial_asyncio library which you can install using

pip install -U pyserial-asyncio

You also need to install ansicolors for colored printing on the console:

pip install -U ansicolors

Full source code

#!/usr/bin/env python3
# -*- coding: utf-8 -*-
__author__ = "Uli Köhler"
__license__ = "CC0 1.0 Universal"

import asyncio
from colors import red
import serial_asyncio

SLIP_END = 0o300
SLIP_ESC = 0o333
SLIP_ESCEND = 0o334
SLIP_ESCESC = 0o335

def handle_slip_message(msg):
    print(f"Received message of length", len(msg))

class SLIPProtocol(asyncio.Protocol):
    def connection_made(self, transport):
        self.msg = bytes() # Message buffer
        self.transport = transport
        print('port opened', transport)
        transport.serial.rts = False  # You can manipulate Serial object via transport
        # Send "enter" to prompt output
        self.buf = b''

    def check_for_slip_message(self):
        # Identify end of message in data
        decoded = []
        last_char_is_esc = False
        for i in range(len(self.buf)):
            c = self.buf[i]
            if last_char_is_esc:
                # This character must be either
                # SLIP_ESCEND or SLIP_ESCESC
                if c == SLIP_ESCEND: # Literal END character
                    decoded.append(SLIP_END)
                elif c == SLIP_ESCESC: # Literal ESC character
                    decoded.append(SLIP_ESC)
                else:
                    print(red("Encountered invalid SLIP escape sequence. Ignoring..."))
                    # Ignore bad part of message
                    self.buf = self.buf[i+1:]
                    break
                last_char_is_esc = False # Reset state
            else: # last char was NOT ESC
                if c == 192: # END of message
                    # Remove current message from buffer
                    self.buf = self.buf[i+1:]
                    # Emit message
                    return bytes(decoded)
                elif c == SLIP_ESC:
                    # Handle escaped character next 
                    last_char_is_esc = True
                else: # Any other character
                    decoded.append(c)
        # No more bytes in buffer => no more message
        return None

    def data_received(self, data):
        # Append new data to buffer
        self.buf += data
        while True:
            msg = self.check_for_slip_message()
            if msg is None:
                break # Need to wait for more data
            else: # msg is not None
                handle_slip_message(msg)

    def connection_lost(self, exc):
        print('port closed')
        self.transport.loop.stop()

    def pause_writing(self):
        print('pause writing')
        print(self.transport.get_write_buffer_size())

    def resume_writing(self):
        print(self.transport.get_write_buffer_size())
        print('resume writing')

loop = asyncio.get_event_loop()
coro = serial_asyncio.create_serial_connection(loop, SLIPProtocol, '/dev/ttyACM0', baudrate=115200)
transport, protocol = loop.run_until_complete(coro)
loop.run_forever()
loop.close()


Posted by Uli Köhler in Embedded, Python

How to fix pip no such option: -U

Problem:

You want to install a python library using, for example

pip -U install ansicolors

However the library does not install and you instead see the following error message:

Usage:   
  pip <command> [options]

no such option: -U

Solution:

You need to put -U after install:

pip install -U ansicolors


Posted by Uli Köhler in Python

Ansicolors minimal example

from colors import black, red, blue

# Print red example
print(red("test"))

# Print bold example
print(black("test", style="bold"))

Install the library using

pip install -U ansicolors


Posted by Uli Köhler in Python

How to fix KiBot ‘KiBoM not installed or too old’

Problem:

When running kibot-check, you see the following warning message:

* KiBoM not installed or too old
  Visit: https://github.com/INTI-CMNB/KiBoM
  Download it from: https://github.com/INTI-CMNB/KiBoM/releases
  - Mandatory for `kibom`

but even installing kibom using pip install kibom, the warning does not disappear.

Solution:

You need to install a specific fork of KiBom:

pip install git+https://github.com/INTI-CMNB/KiBoM

After that, the warning will disappear.

Posted by Uli Köhler in Electronics, KiCAD, Python

How to compute & plot sun path diagram using skyfield in Python

In this example, we’ll show how to generate a sun path diagram for any given day for a preselected location. By using the skyfield library, we can obtain extremely accurate predictions of the sun’s position in the sky, and in contrast to many other libraries, we can use the same method to predict the position of other celestial bodies.

#!/usr/bin/env python3
from skyfield import api
from skyfield import almanac
from datetime import datetime
from datetime import timedelta
from matplotlib import pyplot as plt
import pytz
import dateutil.parser
from collections import namedtuple
from UliEngineering.Utils.Date import *
import matplotlib.ticker as mtick

# Matplotlib formatter
def format_degrees(value, pos=None):
    return f'{value:.0f} °'

ts = api.load.timescale()
ephem = api.load_file('de421.bsp')

sun = ephem["Sun"]
earth = ephem["Earth"]

# Data types
AltAz = namedtuple("AltAz", ["altitude", "azimuth", "distance"])
TimeAltAz = namedtuple("TimeAltAz", ["time", "altitude", "azimuth", "distance"])

def sun_altaz(planet_at_location, ts):
    # Compute the sun position as seen from the observer at <location>
    sun_pos = planet_at_location.at(ts).observe(sun).apparent()
    # Compute apparent altitude & azimuth for the sun's position
    altitude, azimuth, distance = sun_pos.altaz()
    return AltAz(altitude, azimuth, distance)

def sun_altaz_for_day(location, year, month, day, tz):
    earth_at_location = (earth + location)
    
    minutes = list(yield_minutes_on_day(year=year, month=month, day=day, tz=tz))
    skyfield_minutes = ts.from_datetimes(minutes)

    minutely_altaz = [sun_altaz(earth_at_location, ts) for ts in skyfield_minutes]
    # Extract components for plotting
    minutely_alt = [altaz.altitude.degrees for altaz in minutely_altaz]
    minutely_az = [altaz.azimuth.degrees for altaz in minutely_altaz]
    minutely_distance = [altaz.distance for altaz in minutely_altaz]

    return TimeAltAz(minutes, minutely_alt, minutely_az, minutely_distance)

# Random location near Munich
location = api.Topos('48.324777 N', '11.405610 E', elevation_m=519)
# Compute Alt/Az for two different days
jun = sun_altaz_for_day(location, 2022, 6, 15, pytz.timezone("Europe/Berlin"))
dec = sun_altaz_for_day(location, 2022, 12, 15, pytz.timezone("Europe/Berlin"))

# Plot!
plt.gca().yaxis.set_major_formatter(mtick.FuncFormatter(format_degrees))
plt.gca().xaxis.set_major_formatter(mtick.FuncFormatter(format_degrees))

plt.plot(jun.azimuth, jun.altitude, label="15th of June")
plt.plot(dec.azimuth, dec.altitude, label="15th of December")
plt.ylim([0, None]) # Do not show sun angles below the horizon
plt.ylabel("Sun altitude")
plt.xlabel("Sun azimuth")
plt.title("Apparent sun position at our office")
plt.grid() 
plt.gca().legend()
plt.gcf().set_size_inches(10,5)

plt.savefig("Sun path.svg")
 

Posted by Uli Köhler in Physics, Python, skyfield

How to generate datetime for every hour on a given day in Python

This example code generates a timezone-aware datetime for every hour on a given day (minutes & seconds are always set to 0) in a given timezone.

First, install the UliEngineering library and pytz for timezones:

pip install --user UliEngineering pytz

Now you can use UliEngineering.Utils.Date.yield_hours_on_day():

from UliEngineering.Utils.Date import *

for hour in yield_hours_on_day(year=2022, month=6, day=15, tz=pytz.timezone("Europe/Berlin"):
    pass # TODO: Your code goes here

Or, if you want to have a list of datetime instances instead of a generator:

from UliEngineering.Utils.Date import *

hours = list(yield_hours_on_day(year=2022, month=6, day=15, tz=pytz.timezone("Europe/Berlin")))
Posted by Uli Köhler in Python

How to generate datetime for every second on a given day in Python

This example code generates a timezone-aware datetime for every second on a given day in a given timezone.

First, install the UliEngineering library and pytz for timezones:

pip install --user UliEngineering pytz

Now you can use UliEngineering.Utils.Date.yield_seconds_on_day():

from UliEngineering.Utils.Date import *

for second in yield_seconds_on_day(year=2022, month=6, day=15, tz=pytz.timezone("Europe/Berlin"):
    pass # TODO: Your code goes here

Or, if you want to have a list of datetime instances instead of a generator:

from UliEngineering.Utils.Date import *

seconds = list(yield_seconds_on_day(year=2022, month=6, day=15, tz=pytz.timezone("Europe/Berlin")))
Posted by Uli Köhler in Python

How to generate datetime for every minute on a given day in Python

This example code generates a timezone-aware datetime for every minute (the seconds are always set to 0) for a given day in a given timezone.

First, install the UliEngineering library and pytz for timezones:

pip install --user UliEngineering pytz

Now you can use UliEngineering.Utils.Date.yield_minutes_on_day():

from UliEngineering.Utils.Date import *

for minute in yield_minutes_on_day(year=2022, month=6, day=15, tz=pytz.timezone("Europe/Berlin"):
    pass # TODO: Your code goes here

Or, if you want to have a list of datetime instances instead of a generator:

from UliEngineering.Utils.Date import *

minutes = list(yield_minutes_on_day(year=2022, month=6, day=15, tz=pytz.timezone("Europe/Berlin")))
Posted by Uli Köhler in Python

Matplotlib: How to format angle in degrees (°)

Based on our previous post on Matplotlib custom SI-prefix unit tick formatters, this is a simple snippet which you can use to format the Y axis of your matplotlib plots. In our example, the function shows 2 digits after the decimal points (.2f) but you can change that to how ever many you prefer.

import matplotlib.ticker as mtick
from matplotlib import pyplot as plt

def format_degrees(value, pos=None):
    return f'{value:.2f} °'

plt.gca().yaxis.set_major_formatter(mtick.FuncFormatter(format_degrees))

Example diagram

From our post How to compute & plot sun path diagram using skyfield in Python

Posted by Uli Köhler in Python

How to convert skyfield Time into datetime at specific timezone

When you have a skyfield Time object like

t = ts.now()
# Example: <Time tt=2459750.027604357>

you can convert it to a Python datetime in a specific timezone (Europe/Berlin in this example) using .astimezone() and the pytz library:

t.astimezone(pytz.timezone("Europe/Berlin"))
# Example: datetime.datetime(2022, 6, 19, 14, 38, 35, 832445, tzinfo=<DstTzInfo 'Europe/Berlin' CEST+2:00:00 DST>)

Complete example

from skyfield import api
from datetime import datetime
import pytz

ts = api.load.timescale()
t = ts.now()
dt = t.astimezone(pytz.timezone("Europe/Berlin"))
print(dt) # e.g. 2022-06-19 14:42:47.406786+02:00


Posted by Uli Köhler in Python, skyfield

How to compute position of sun in the sky in Python using skyfield

The following code computes the position of the sun (in azimuth/altitude coordinates) in the sky using the skyfield library. Note that you need to download de421.bsp .

from skyfield import api
from skyfield import almanac
from datetime import datetime
from datetime import timedelta
import dateutil.parser
from calendar import monthrange

ts = api.load.timescale()
ephem = api.load_file('de421.bsp')

sun = ephem["Sun"]
earth = ephem["Earth"]

# Compute sunrise & sunset for random location near Munich
location = api.Topos('48.324777 N', '11.405610 E', elevation_m=519)
# Compute the sun position as seen from the observer at <location>
sun_pos = (earth + location).at(ts.now()).observe(sun).apparent()
# Compute apparent altitude & azimuth for the sun's position
altitude, azimuth, distance = sun_pos.altaz()

# Print results (example)
print(f"Altitude: {altitude.degrees:.4f} °")
print(f"Azimuth: {azimuth.degrees:.4f} °")

Example output

Altitude: -3.3121 °
Azimuth: 48.4141 °

Factors influencing the accuracy of the calculation

This way of calculating the position takes into account:

  • The slight shift in position caused by light speed
  • The very very slight shift in position caused by earth’s gravity

But it does not take into account:

  • Atmospheric distortions shifting the sun’s position
  • The extent of the sun’s disk causing the sun to emanate not from a point but apparently from an area
Posted by Uli Köhler in Physics, Python, skyfield

How to fix Python skyfield FileNotFoundError: [Errno 2] No such file or directory: ‘de421.bsp’

Problem:

When trying to use the Python skyfield library, you see an exception like

Input In [2], in <cell line: 11>()
      8 from calendar import monthrange
     10 ts = api.load.timescale()
---> 11 ephem = api.load_file('de413.bsp')

File /usr/local/lib/python3.10/dist-packages/skyfield/iokit.py:412, in load_file(path)
    410 base, ext = os.path.splitext(path)
    411 if ext == '.bsp':
--> 412     return SpiceKernel(path)
    413 raise ValueError('unrecognized file extension: {}'.format(path))

File /usr/local/lib/python3.10/dist-packages/skyfield/jpllib.py:71, in SpiceKernel.__init__(self, path)
     69 self.path = path
     70 self.filename = os.path.basename(path)
---> 71 self.spk = SPK.open(path)
     72 self.segments = [SPICESegment(self, s) for s in self.spk.segments]
     73 self.codes = set(s.center for s in self.segments).union(
     74                  s.target for s in self.segments)

File /usr/local/lib/python3.10/dist-packages/jplephem/spk.py:49, in SPK.open(cls, path)
     46 @classmethod
     47 def open(cls, path):
     48     """Open the file at `path` and return an SPK instance."""
---> 49     return cls(DAF(open(path, 'rb')))

FileNotFoundError: [Errno 2] No such file or directory: 'de421.bsp'

Solution:

Take a look at the api.load(...) line in your code:

ephem = api.load_file('de421.bsp')

It tries to load the data from the file de421.bsp in the current directory. This file contains positional data of objects in the sky and you need to manually download that file.

You can download the file from NASA. Just take care to either place it into the right directory or modifying the path in the api.load() call to point to the file.

URL for downloading the file:

https://ssd.jpl.nasa.gov/ftp/eph/planets/bsp/de421.bsp

My preferred way to download it is using wget:

wget https://ssd.jpl.nasa.gov/ftp/eph/planets/bsp/de421.bsp

This command will place the file into the current directory.

Posted by Uli Köhler in Python, skyfield

How to compute sunrise & sunset in Python using skyfield

The following code will compute the sunrise & sunset at a specific location & elevation using the skyfield library. Note that you need to download de413.bsp .

from skyfield import api
from skyfield import almanac
from datetime import datetime
from datetime import timedelta
import dateutil.parser
from calendar import monthrange

ts = api.load.timescale()
ephem = api.load_file('de413.bsp')

def compute_sunrise_sunset(location, year=2019, month=1, day=1):
    t0 = ts.utc(year, month, day, 0)
    # t1 = t0 plus one day
    t1 = ts.utc(t0.utc_datetime() + timedelta(days=1))
    t, y = almanac.find_discrete(t0, t1, almanac.sunrise_sunset(ephem, location))
    sunrise = None
    for time, is_sunrise in zip(t, y):
        if is_sunrise:
            sunrise = dateutil.parser.parse(time.utc_iso())
        else:
            sunset = dateutil.parser.parse(time.utc_iso())
    return sunrise, sunset

# Compute sunrise & sunset for random location near Munich
location = api.Topos('48.324777 N', '11.405610 E', elevation_m=519)
now = datetime.now()
sunrise, sunset = compute_sunrise_sunset(location, now.year, now.month, now.day)

# Print result (example)
print(f'Sunrise today: {sunrise}')
print(f'Sunset today: {sunset}')

Definition of sunrise & sunset in this context

According to the skyfield documentation:

Skyfield uses the same definition as the United States Naval Observatory: the Sun is up when its center is 0.8333 degrees below the horizon, which accounts for both its apparent radius of around 16 arcminutes and also for the 34 arcminutes by which atmospheric refraction on average lifts the image of the Sun.

Other caveats

  • Note that obstructions like mountains are not taken into account for this model
  • Note that the resulting timestamps are UTC, if you want local time, you’ll have to convert them appropriately

Example output:

Sunrise today: 2022-06-19 03:12:56+00:00
Sunset today: 2022-06-19 19:18:38+00:00


Posted by Uli Köhler in Physics, Python, skyfield

How to fix Python skyfield FileNotFoundError: [Errno 2] No such file or directory: ‘de413.bsp’

Problem:

When trying to use the Python skyfield library, you see an exception like

Input In [2], in <cell line: 11>()
      8 from calendar import monthrange
     10 ts = api.load.timescale()
---> 11 ephem = api.load_file('de413.bsp')

File /usr/local/lib/python3.10/dist-packages/skyfield/iokit.py:412, in load_file(path)
    410 base, ext = os.path.splitext(path)
    411 if ext == '.bsp':
--> 412     return SpiceKernel(path)
    413 raise ValueError('unrecognized file extension: {}'.format(path))

File /usr/local/lib/python3.10/dist-packages/skyfield/jpllib.py:71, in SpiceKernel.__init__(self, path)
     69 self.path = path
     70 self.filename = os.path.basename(path)
---> 71 self.spk = SPK.open(path)
     72 self.segments = [SPICESegment(self, s) for s in self.spk.segments]
     73 self.codes = set(s.center for s in self.segments).union(
     74                  s.target for s in self.segments)

File /usr/local/lib/python3.10/dist-packages/jplephem/spk.py:49, in SPK.open(cls, path)
     46 @classmethod
     47 def open(cls, path):
     48     """Open the file at `path` and return an SPK instance."""
---> 49     return cls(DAF(open(path, 'rb')))

FileNotFoundError: [Errno 2] No such file or directory: 'de413.bsp'

Solution:

Take a look at the api.load(...) line in your code:

ephem = api.load_file('de413.bsp')

It tries to load the data from the file de413.bsp in the current directory. This file contains positional data of objects in the sky and you need to manually download that file.

You can download the file from NASA. Just take care to either place it into the right directory or modifying the path in the api.load() call to point to the file.

URL for downloading the file:

https://ssd.jpl.nasa.gov/ftp/eph/planets/bsp/de413.bsp

My preferred way to download it is using wget:

wget https://ssd.jpl.nasa.gov/ftp/eph/planets/bsp/de413.bsp

This command will place the file into the current directory.

Posted by Uli Köhler in Python, skyfield

How to install ESP32 esptool / esptool.py on Ubuntu

The recommended way is to install the current version using pip since the version installed using apt might be out of date:

sudo pip install esptool

After that, you can use esptool.py – note that you need to call it as esptool.py, not just as esptool!

In case you are missing pip , install python3-dev using apt:

sudo apt -y install python3-pip


Posted by Uli Köhler in ESP8266/ESP32, Linux, Python

How to convert collections.Counter to pandas DataFrame

Pandas can take care of the conversion of a Counter to a DataFrameby itself but you need to add a column label:

pd.DataFrame({"YourColumnLabelGoesHere": counterObject})

Full example

import pandas as pd
from collections import Counter

ctr = Counter()
ctr["a"] += 1
ctr["b"] += 1
ctr["a"] += 1
ctr["a"] += 1
ctr["b"] += 1
ctr["a"] += 1
ctr["c"] += 1

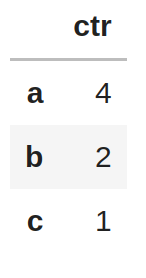
pd.DataFrame({"ctr": ctr})

This will result in the following DataFrame:


Posted by Uli Köhler in pandas, Python

structlog minimal example

import structlog

logger = structlog.get_logger()

# Usage example
logger.info("Test log")


Posted by Uli Köhler in Python

How to fix matplotlib OSError: ‘xkcd’ not found in the style library

Problem:

While trying to enable the matplotlib xkcd style using

plt.style.use("xkcd")

you see the following error message:

OSError: 'xkcd' not found in the style library and input is not a valid URL or path; see `style.available` for list of available styles

Solution:

You can’t enable xkcd-style plots by running plt.style.use("xkcd"). Instead, use with plt.xkcd():

with plt.xkcd():
    # TODO your plotting code goes here!
    # plt.plot(x, y) # Example


Posted by Uli Köhler in Python