Problem:
You are trying to save your DataFrame in an SQL database using pandas to_sql(), but you see an exception like
---------------------------------------------------------------------------
AttributeError                            Traceback (most recent call last)
<ipython-input-21-3788db1a4131> in <module>
      7 db = sqlalchemy.create_engine('sqlite:///timeseries.db' class="ansi-blue-fg">)
      8
----> 9 df.to_sql('timeseries', df)

~/miniconda3/lib/python3.8/site-packages/pandas/core/generic.py in to_sql(self, name, con, schema, if_exists, index, index_label, chunksize, dtype, method)
   2603         from pandas.io import sql
   2604
-> 2605         sql.to_sql(
   2606             self,
   2607             name,

~/miniconda3/lib/python3.8/site-packages/pandas/io/sql.py in to_sql(frame, name, con, schema, if_exists, index, index_label, chunksize, dtype, method)
    587         )
    588
--> 589     pandas_sql.to_sql(
    590         frame,
    591         name,

~/miniconda3/lib/python3.8/site-packages/pandas/io/sql.py in to_sql(self, frame, name, if_exists, index, index_label, schema, chunksize, dtype, method)
   1825             dtype=dtype,
   1826         )
-> 1827         table.create()
   1828         table.insert(chunksize, method)
   1829

~/miniconda3/lib/python3.8/site-packages/pandas/io/sql.py in create(self)
    719
    720     def create(self):
--> 721         if self.exists():
    722             if self.if_exists == "fail":
    723                 raise ValueError(f"Table '{self.name}' already exists.")

~/miniconda3/lib/python3.8/site-packages/pandas/io/sql.py in exists(self)
    706
    707     def exists(self):
--> 708         return self.pd_sql.has_table(self.name, self.schema)
    709
    710     def sql_schema(self):

~/miniconda3/lib/python3.8/site-packages/pandas/io/sql.py in has_table(self, name, schema)
   1836         query = f"SELECT name FROM sqlite_master WHERE type='table' AND name={wld};"
   1837
-> 1838         return len(self.execute(query, [name]).fetchall()) > 0
   1839
   1840     def get_table(self, table_name, schema=None):

~/miniconda3/lib/python3.8/site-packages/pandas/io/sql.py in execute(self, *args, **kwargs)
   1677             cur = self.con
   1678         else:
-> 1679             cur = self.con.cursor()
   1680         try:
   1681             cur.execute(*args, **kwargs)

~/miniconda3/lib/python3.8/site-packages/pandas/core/generic.py in __getattr__(self, name)
   5137             if self._info_axis._can_hold_identifiers_and_holds_name(name):
   5138                 return self[name]
-> 5139             return object.__getattribute__(self, name)
   5140
   5141     def __setattr__(self, name: str, value) -> None:

AttributeError: 'DataFrame' object has no attribute 'cursor'
Solution:
You’re calling to_sql() with the wrong arguments! The second argument needs to be the database connection (e.g. an sqlalchemy engine)! You’re probably calling it like this:
df.to_sql('timeseries', df)but the second argument needs to be db (or whatever your database connection object is named), not df!
Full working example for to_sql()
import pandas as pd
# Load pre-built time series example dataset
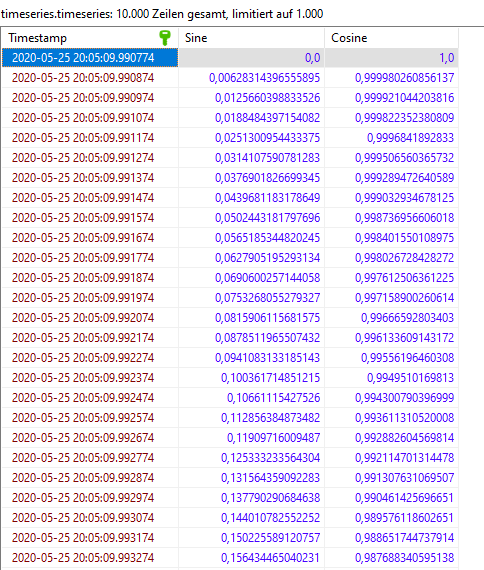
df = pd.read_csv("https://datasets.techoverflow.net/timeseries-example.csv", parse_dates=["Timestamp"])
df.set_index("Timestamp", inplace=True)
import sqlalchemy
db = sqlalchemy.create_engine('sqlite:///timeseries.db')
df.to_sql('timeseries', db, if_exists="replace")