
PlotJuggler - ZMQ - Python minimales Datenquellen-Beispiel
Das folgende Beispiel dient als Ausgangspunkt, wie man eine benutzerdefinierte Datenquelle für PlotJuggler mit Python und ZeroMQ entwickelt.
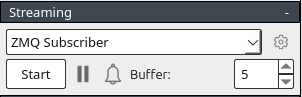
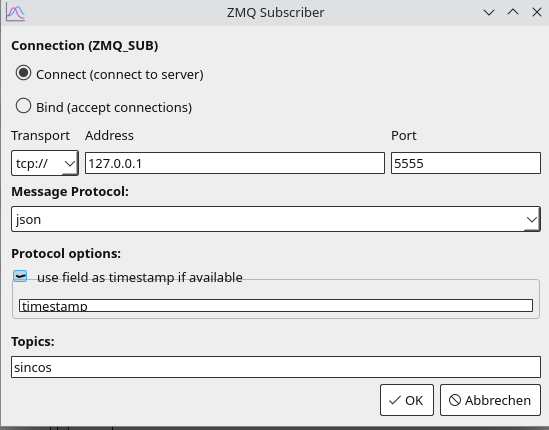
Um es zu verwenden, konfigurieren Sie PlotJuggler so
plotjuggler_zmq_producer.py
import zmq
import time
import json
import math

# ZeroMQ setup
context = zmq.Context()
socket = context.socket(zmq.PUB)
socket.bind("tcp://*:5555")  # Bind to a port PlotJuggler will connect to

# Generate and send data
time_start = time.time()
try:
    while True:
        elapsed_time = time.time() - time_start
        value = {
            "timestamp": elapsed_time,  # Zeit in Sekunden seit Scriptstart
            "variables": {
                "sin": math.sin(elapsed_time),  # Sinuswelle
                "cos": math.cos(elapsed_time),  # Kosinuswelle
            },
        }

        # Sende Daten als JSON mit dem Thema "sincos"
        socket.send_string("sincos", zmq.SNDMORE)
        socket.send_string(json.dumps(value))
        time.sleep(0.01)  # 100 Hz Update-Rate
except KeyboardInterrupt:
    print("Datenstrom unterbrochen.")
finally:
    socket.close()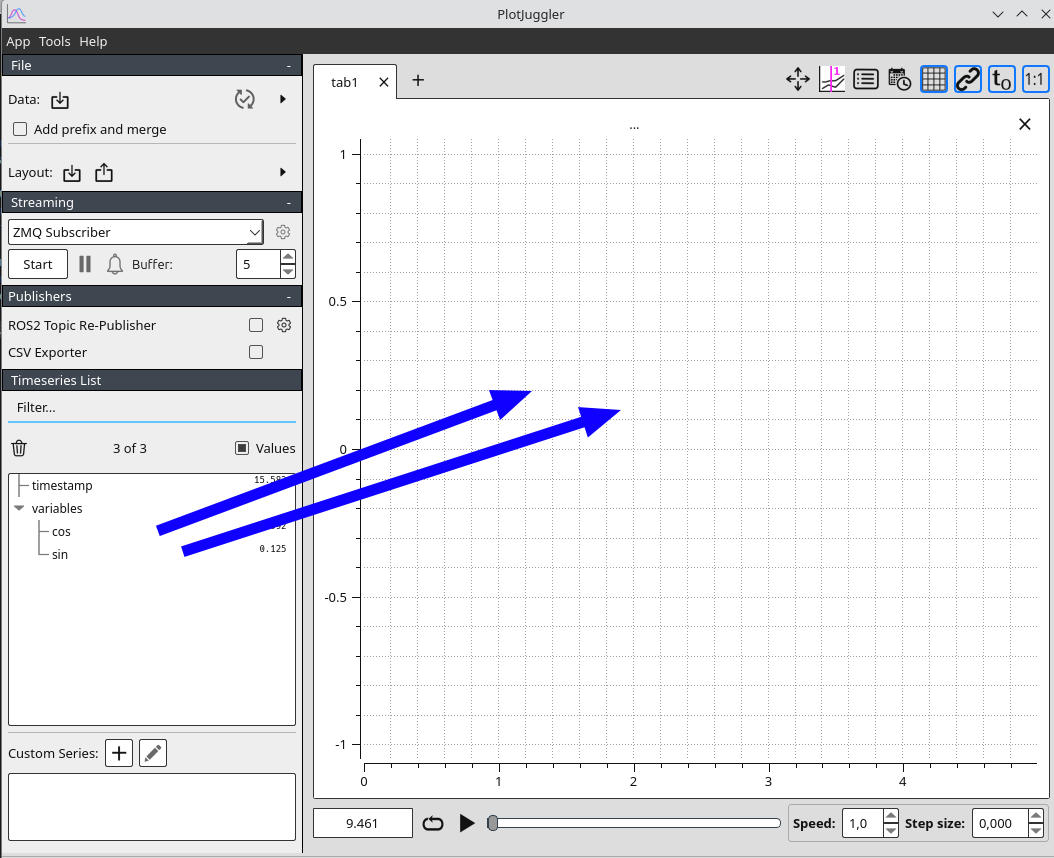
context.term()Klicken Sie nun auf Start im Streaming-Tab und vergessen Sie nicht, die sin- und cos-Variablen in den Plot zu ziehen.
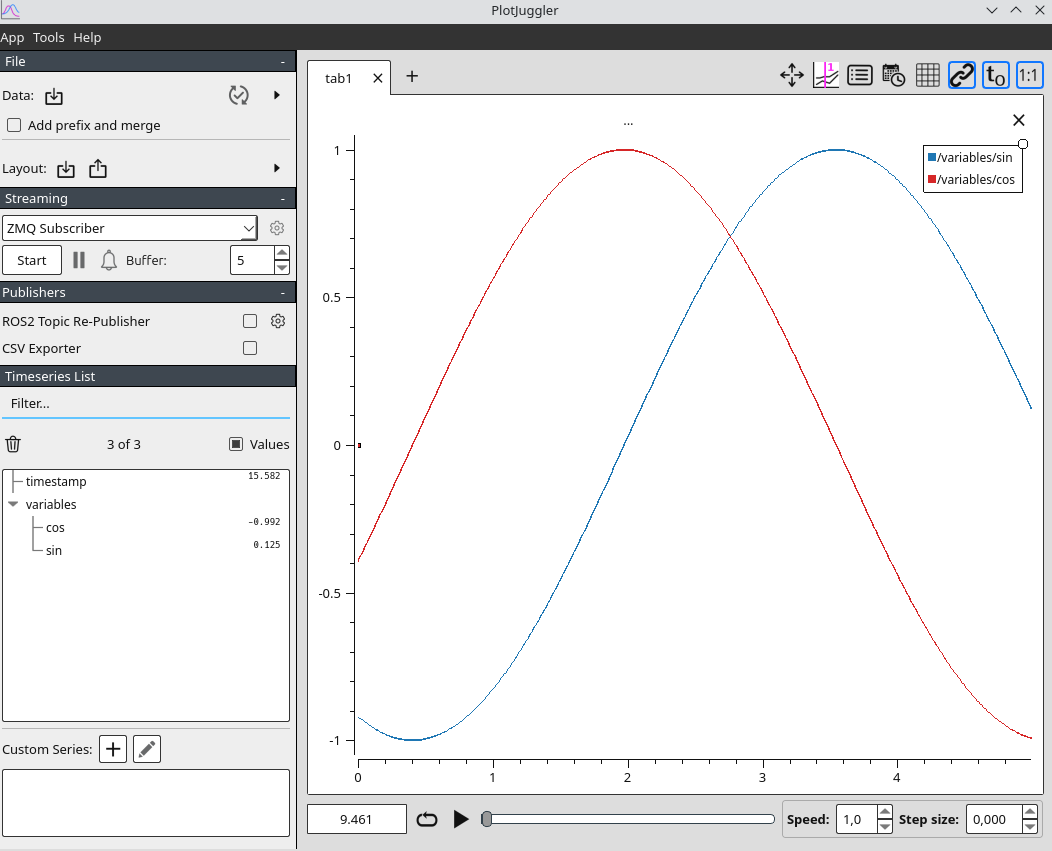
Ausgabe-Beispiel
If this post helped you, please consider buying me a coffee or donating via PayPal to support research & publishing of new posts on TechOverflow