
Pandas:如何将 numpy 函数应用到每一列
你可以使用 df.transform(func, axis=0) 应用 numpy 函数。这利用了 numpy 函数与 pandas Series 对象一起工作的事实。
基于如何创建 pandas 时间序列 DataFrame 示例数据集的示例:
pandas_apply_numpy_to_columns.py
# 加载预构建的时间序列示例数据集
df = pd.read_csv("https://datasets.techoverflow.net/timeseries-example.csv", parse_dates=["Timestamp"])
df.set_index("Timestamp", inplace=True)

# np.square 将为每列单独调用
new_df = df.transform(np.square, axis=0)输出
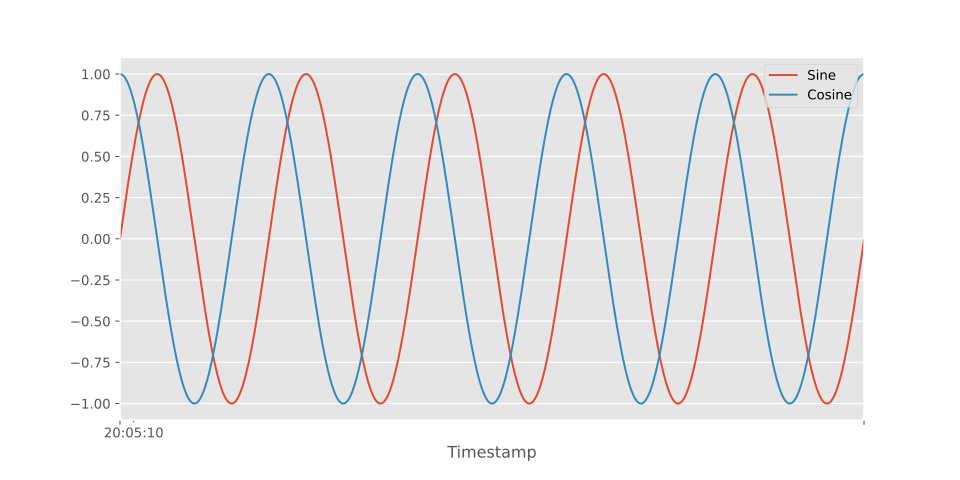
原始时间序列:
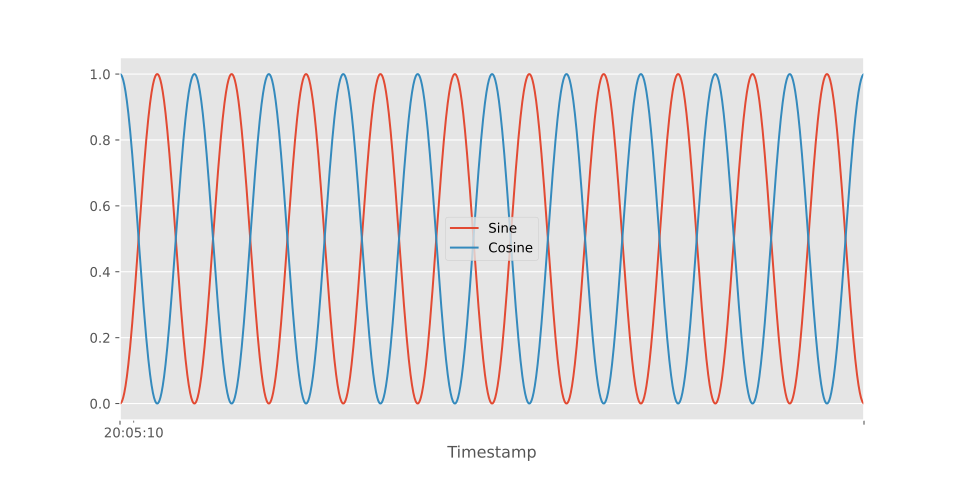
 平方时间序列:
完整示例代码
pandas_apply_numpy_full.py
import numpy as np
import pandas as pd
from matplotlib import pyplot as plt

# 加载预构建的时间序列示例数据集
df = pd.read_csv("https://datasets.techoverflow.net/timeseries-example.csv", parse_dates=["Timestamp"])
df.set_index("Timestamp", inplace=True)

# np.sqrt 将为每列单独调用
new_df = df.transform(np.square, axis=0)

# 绘制原始 DF 的子部分以获得更好的可见性
df.iloc[:len(df)//2].plot()
plt.gcf().set_size_inches(10,5)
plt.savefig("Normal-Timeseries.svg")

# 绘制转换后 DF 的子部分以获得更好的可见性
new_df.iloc[:len(df)//2].plot()
plt.gcf().set_size_inches(10,5)
plt.savefig("Square-Timeseries.svg")If this post helped you, please consider buying me a coffee or donating via PayPal to support research & publishing of new posts on TechOverflow