
TechOverflow
Based in Munich, our engineers & laboratory helps you to develop your product from the first idea to certification & production.

We make your products come alive
TechOverflow provides professional consulting services covering electronic, firmware & software development.
Our focus is on early-phase product development on the edge of what's possible with current technology. We don't shy away from trying out new technology and will never be limited by what we used for the last projects
In contrast to other consulting companies, we always keep the cost in mind - both regarding the cost of development and the cost of the final product
If you are in need of a re-engineering of your project by engineers who are not limited to understanding only one aspect of your product, feel free to contact us for a free discussion of your project.
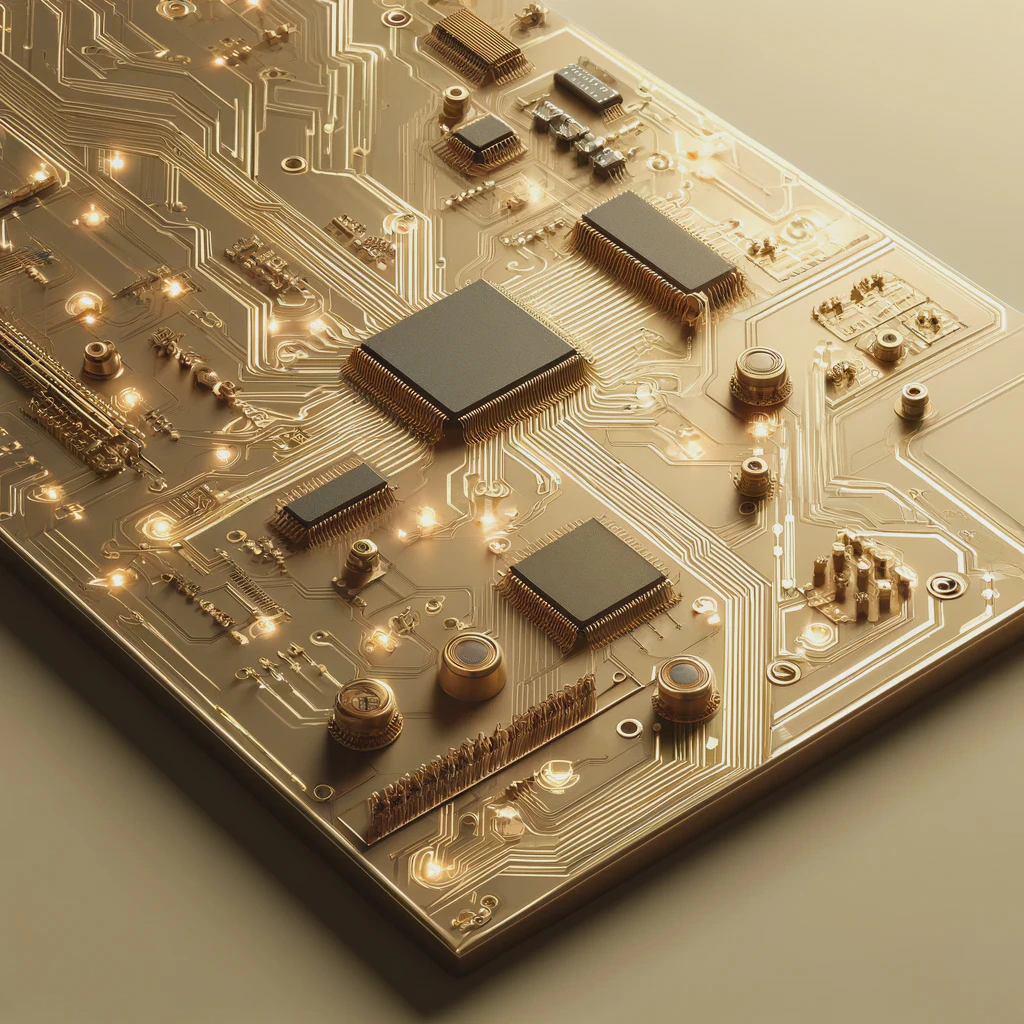
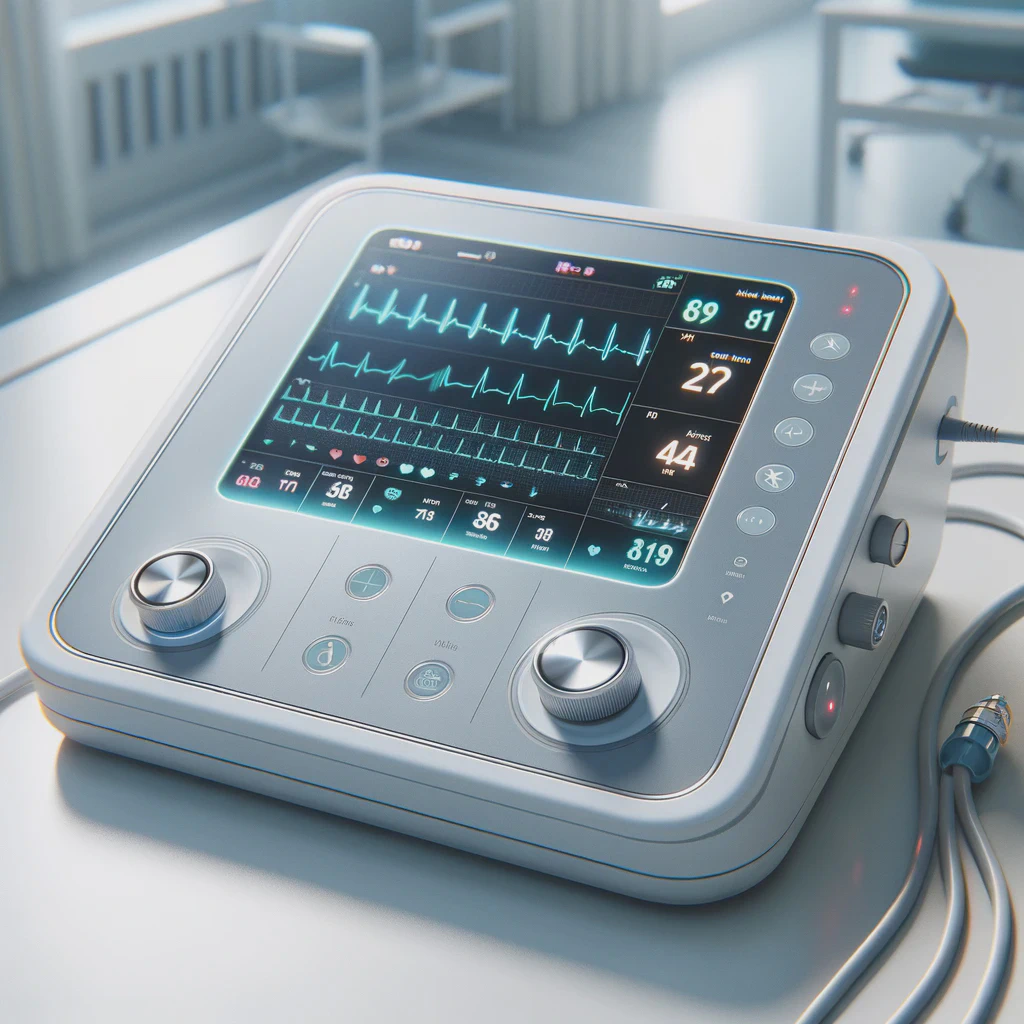
From prototypes to medical devices
Covering the entire technology value chain including electronic, firmware and software with cloud integration, we are able to provide full-stack solution
TechOverflow uses Open-Source tools whereever possible. Not just because they are cost-effective, but more importantly because that makes it easier for our customers and external software and developers to integrate with our solutions.
We are actively developing and maintaining a number of Open-Source projects, focussing on providing standardized, yet customizable solutions for automating all processes of the product lifecycle.


Our customers
Our international customers originate from various industries and sectors but are joined by their desire to completely re-think their technologies.
TechOverflow blog
Driven by the desire that no developer should have to manually resolve issues which have already been solved countless times, TechOverflow provides almost 3000 free blogposts on topics ranging from programming to electronics and dev-ops, each of which focuses just on how to solve the problem at hand.
Uli Köhler
Uli Köhler
Uli Köhler
Uli Köhler