
How to plot cumulative Gitlab group members using matplotlib
This is based on my previous post to find the group ID by group name.
plot_cumulative.py
import matplotlib.pyplot as plt
import matplotlib.dates as mdates
from datetime import datetime
import gitlab

def plot_cumulative_members(members):
    # Convert date strings to datetime objects and sort
    dates = sorted([datetime.strptime(member["access_granted_date"], '%Y-%m-%dT%H:%M:%S.%fZ') for member in members])

    # Calculate cumulative count
    cumulative_count = range(1, len(dates) + 1)

    # Plotting
    plt.figure(figsize=(10, 6))
    plt.plot(dates, cumulative_count, marker='o')
    plt.title('Cumulative Number of Users in GitLab Group Over Time')
    plt.xlabel('Date')
    plt.ylabel('Cumulative Number of Users')
    plt.grid(True)
    plt.gca().xaxis.set_major_formatter(mdates.DateFormatter('%Y-%m-%d'))
    plt.gca().xaxis.set_major_locator(mdates.YearLocator())
    plt.gcf().autofmt_xdate()  # Rotation
    plt.show()

group_id = get_gitlab_group_id("Protectors of the Footprint Realm", 'glpat-...')
members = get_group_members(group_id, 'glpat-...')
with plt.xkcd():
    plot_cumulative_members(members)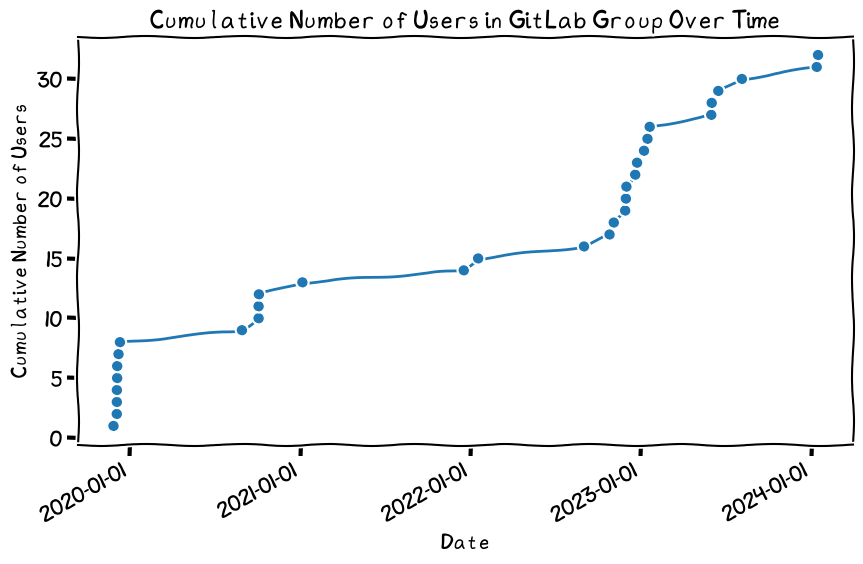
If this post helped you, please consider buying me a coffee or donating via PayPal to support research & publishing of new posts on TechOverflow