pandas

How to convert collections.Counter to pandas DataFrame

Pandas can take care of the conversion of a Counter to a DataFrameby itself but you need to add a column label:

pd.DataFrame({"YourColumnLabelGoesHere": counterObject})

Full example

import pandas as pd
from collections import Counter

ctr = Counter()
ctr["a"] += 1
ctr["b"] += 1
ctr["a"] += 1
ctr["a"] += 1
ctr["b"] += 1
ctr["a"] += 1
ctr["c"] += 1

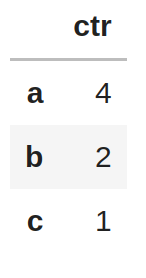
pd.DataFrame({"ctr": ctr})

This will result in the following DataFrame:


Posted by Uli Köhler in pandas, Python

Pandas: How to apply numpy function to every column

You can use df.transform(func, axis=0) to apply a numpy function. This leverages the fact that numpy functions work with pandas Series objects.

Example based on How to create pandas time series DataFrame example dataset:

# Load pre-built time series example dataset
df = pd.read_csv("https://datasets.techoverflow.net/timeseries-example.csv", parse_dates=["Timestamp"])
df.set_index("Timestamp", inplace=True)

# np.square will be called individually for each column
new_df = df.transform(np.square, axis=0)

Output

Original time series:

Squared time series:

Full example code

import numpy as np
import pandas as pd
from matplotlib import pyplot as plt

# Load pre-built time series example dataset
df = pd.read_csv("https://datasets.techoverflow.net/timeseries-example.csv", parse_dates=["Timestamp"])
df.set_index("Timestamp", inplace=True)

# np.sqrt will be called individually for each column
new_df = df.transform(np.square, axis=0)

# Plot subsection of original DF for better visibility
df.iloc[:len(df)//2].plot()
plt.gcf().set_size_inches(10,5)
plt.savefig("Normal-Timeseries.svg")

# Plot subsection of transformed DF for better visibility
new_df.iloc[:len(df)//2].plot()
plt.gcf().set_size_inches(10,5)
plt.savefig("Square-Timeseries.svg")


Posted by Uli Köhler in pandas, Python

matplotlib: How to easily format y value as percent [%]

When plotting our time series example dataset, this is the resulting plot

This post shows how to easily plot this dataset with an y axis formatted as percent. We will assume that 1.00 maps to 100%. This post is based on our previous work on Matplotlib custom SI-prefix unit tick formatter:

Note that for pandas, you need to first call df.plot() and call set_major_formatter() after that!

import matplotlib.ticker as mtick
df.plot()
plt.gca().yaxis.set_major_formatter(mtick.PercentFormatter(xmax=1.0))

If you instead want 100.0 to map to 100%, just use xmax=100.0:

import matplotlib.ticker as mtick
df.plot()
plt.gca().yaxis.set_major_formatter(mtick.PercentFormatter(xmax=1.0))

Full example

import matplotlib.ticker as mtick

# Load pre-built time series example dataset
df = pd.read_csv("https://datasets.techoverflow.net/timeseries-example.csv", parse_dates=["Timestamp"])
df.set_index("Timestamp", inplace=True)

# Plot with Y axis scaled as percent
df.plot()
plt.gca().yaxis.set_major_formatter(mtick.PercentFormatter(xmax=1.0))


Posted by Uli Köhler in pandas, Python

How to get first column name of pandas DataFrame

df.columns[0]

will return the name of the first column as str.

Posted by Uli Köhler in pandas, Python

How to plot multiple pandas DataFrames in a single graph

If you use code like

df1.plot()
df2.plot()

you will see both DataFrames being plotted each in their separate graphs/plots.

In order to plot both of them in a single plot, use

ax = df1.plot()
df2.plot(ax=ax)
Posted by Uli Köhler in pandas, Python

How to combine two pandas DataFrames with the same index

If you have two pandas DataFrames you want to join where the index in both DataFrames are and you want to obtain a DataFrame where the respective columns are set to NaN if there is no value from the respective DataFrame, this is typically the correct way to do it:

df_compare = pd.concat([df1, df2], axis=1, join='outer')

If you only want to keep values where both DataFrames have some value, use join='outer'

Posted by Uli Köhler in pandas, Python

How to rename a single column of a pandas DataFrame

In our previous post How to replace string in column names in Pandas DataFrame we already covered a generic method of renaming pandas columns by replacing strings.

If you just want to rename a specific column, say, the column is named value and you want to convert it to , use this snippet:

new_df = df.rename(columns=lambda s: "€" if s == "value" else s)

or use inplace=True if you want to modify the original DataFrame:

df.rename(columns=lambda s: "€" if s == "value" else s, inplace=True)


Posted by Uli Köhler in pandas, Python

How to fix pandas AttributeError: module ‘pandas’ has no attribute ‘timedelta’

Problem:

While running your Python code or Jupyter notebook, you see an error message like

---------------------------------------------------------------------------
AttributeError                            Traceback (most recent call last)
/tmp/ipykernel_99995/3617538487.py in <module>
      1 for date in df.index:
----> 2     print(date - pd.timedelta(5, 'years'))

/usr/local/lib/python3.9/dist-packages/pandas/__init__.py in __getattr__(name)
    259         return _SparseArray
    260 
--> 261     raise AttributeError(f"module 'pandas' has no attribute '{name}'")
    262 
    263 

AttributeError: module 'pandas' has no attribute 'timedelta'

Solution:

pandas Timedelta is spelled with a capital T: Timedelta not timedelta.

Posted by Uli Köhler in pandas, Python

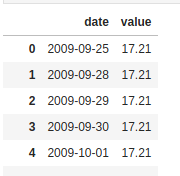
How to parse date column in pandas

If you have a pandas column containing a date string

df


which is listed as object:

df["date"]

parse it like this:

df["date"] = pd.to_datetime(df["date"])

After which it will be listed as datetime64[ns]:

df["date"]

Posted by Uli Köhler in pandas, Python

How to center-align all columns in pandas XLSX export

In our previous post How to center-align column in pandas XLSX export we showed how to center-align one specific column in a XLSX export.

In this post, we’ll show how to center all columns in a pandas DataFrame XLSX export. Note that the variants with and without index shown here differ only in the column index computation. Pandas automatically centers the index column, so we don’t need to do that explicitly.

For export with index

# Center all columns
for column_idx in range(len(df.columns)):
    for cell in sheet[openpyxl.utils.cell.get_column_letter(column_idx + 1)]:
        cell.alignment = Alignment(horizontal="center")

For export without index

# Center all columns
for column_idx in range(len(df.columns)):
    for cell in sheet[openpyxl.utils.cell.get_column_letter(column_idx + 1)]:
        cell.alignment = Alignment(horizontal="center")

Full example:

import pandas as pd
import openpyxl.utils.cell
from openpyxl.styles.alignment import Alignment

df = pd.DataFrame([
    {"a": 1.0},
    {"a": 2.0},
    {"a": 3.0},
    {"a": 4.0},
    {"a": 5.0},
])
with pd.ExcelWriter("out.xlsx", engine="openpyxl") as writer:
    sheet_name = "Bool"
    # Export DataFrame content
    df.to_excel(writer, sheet_name=sheet_name)
    # Align to center
    sheet = writer.sheets[sheet_name]
    # Center all columns
    for column_idx in range(len(df.columns) + 1):
        for cell in sheet[openpyxl.utils.cell.get_column_letter(column_idx + 1)]:
            cell.alignment = Alignment(horizontal="center")

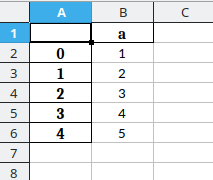
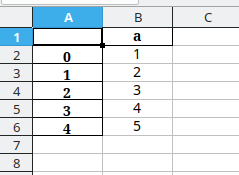
The table will look like this with the centering enabled:

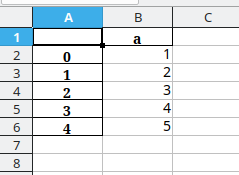
whereas the table is right-aligned with only the title centered by Pandas with the centering code disabled: – Note that the index column is centered automatica

Posted by Uli Köhler in OpenPyXL, pandas, Python

How to center-align column in pandas XLSX export

Note: Want to align all columns in the export? See our followup post How to center-align all columns in pandas XLSX export

When exporting a DataFrame in pandas, often you want to center a column in order to make the resulting table visually more appealing.

In this post we’ll show how to do this using the openpyxl engine.

If you want to center column B, add this code within the pd.ExcelWriter with: block:

for cell in sheet["B"]:
    cell.alignment = Alignment(horizontal="center")

Full example:

import pandas as pd
from openpyxl.styles.alignment import Alignment

df = pd.DataFrame([
    {"a": 1.0},
    {"a": 2.0},
    {"a": 3.0},
    {"a": 4.0},
    {"a": 5.0},
])
with pd.ExcelWriter("out.xlsx", engine="openpyxl") as writer:
    sheet_name = "Bool"
    # Export DataFrame content
    df.to_excel(writer, sheet_name=sheet_name)
    # Align to center
    sheet = writer.sheets[sheet_name]
    # Align every cell in column "B" horizontally
    for cell in sheet["B"]:
        cell.alignment = Alignment(horizontal="center")

The table will look like this with the centering enabled:

whereas the table is right-aligned with only the title centered by Pandas with the centering code disabled:

Posted by Uli Köhler in OpenPyXL, pandas, Python

How to write Pandas bool column as True/False instead of 1/0 to XLSX

Problem:

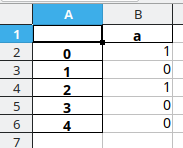
When writing a pandas XLSX, bool-type columns are shown are 0 for False or 1 for True.

df = pd.DataFrame([
    {"a": True},
    {"a": False},
    {"a": True},
    {"a": False},
    {"a": False},
])

with pd.ExcelWriter("out.xlsx", engine="xlsxwriter") as writer:
    df.to_excel(writer)

Solution:

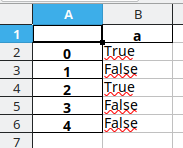
Map the column to a string column with your desired value before exporting:

df["a"] = df["a"].map({True: "True", False: "False"})

Full example code:

df = pd.DataFrame([
    {"a": True},
    {"a": False},
    {"a": True},
    {"a": False},
    {"a": False},
])
df["a"] = df["a"].map({True: "True", False: "False"})
with pd.ExcelWriter("out.xlsx", engine="xlsxwriter") as writer:
    df.to_excel(writer)


Posted by Uli Köhler in pandas, Python

How to create pandas pd.DataFrame from list of dicts

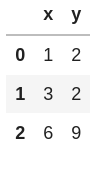
You can create a pandas pd.DataFrame from a list of dicts (lst) using the pd.DataFrame(lst) constructor.

a = {"x": 1, "y": 2}
b = {"x": 3, "y": 2}
c = {"x": 6, "y": 9}
df = pd.DataFrame([a,b,c])

df will look like this:

Posted by Uli Köhler in pandas, Python

How to read single value from XLS(X) using pandas

pandas can be used conveniently to read a table of values from Excel. When extracting data from real-life Excel sheets, there are often metadata fields which are not structured as a table readable by pandas.

Reading the pandas docs, it is not obvious how we can extract the value of a single cell (without any associated headers) with a fixed position, for example:

In this example, we want to extract cell C3, that is we want to end up with a string of value Test value #123. Since there is no clear table structure in this excel sheet (and other cells might contain other values we are not interested in – for example, headlines or headers), we don’t want to have a pd.DataFrame but simply a string.

This is how you can do it:


def read_value_from_excel(filename, column="C", row=3):
    """Read a single cell value from an Excel file"""
    return pd.read_excel(filename, skiprows=row - 1, usecols=column, nrows=1, header=None, names=["Value"]).iloc[0]["Value"]

# Example usage
read_value_from_excel(“Test.xlsx”, “C”, 3) # Prints
Let’s explain the parameters we’re using as arguments to pd.read_excel():

  • Test.xlsx: The filename of the file you want to read
  • skiprows=2: Row number minus one, so the desired row is the first we read
  • usecols="C": Which columns we’re interested in – only one!
  • nrows=1: Read only a single row
  • header=None: Do not assume that the first row we read is a header row
  • names=["Value"]: Set the name for the single column to Value
  • .iloc[0]: From the resulting pd.DataFrame, get the first row ([0]) by index (iloc)
  • ["Value"] From the resulting row, extract the "Value" column – which is the only column available.

In my opinion, using pandas is the best way of extracting for most real-world usecases (i.e. more focused on development speed than on execution speed) because not only does it provide automatic engine selection for .xls and .xlsx files, it’s also present on most Data Science setups anyway and provides a standardized API.

Posted by Uli Köhler in pandas, Python

How to fix pandas pd.read_excel() error XLRDError: Excel xlsx file; not supported

Problem:

When trying to read an .xlsx file using pandas pd.read_excel() you see this error message:

XLRDError: Excel xlsx file; not supported

Solution:

The xlrd library only supports .xls files, not .xlsx files. In order to make pandas able to read .xlsx files, install openpyxl:

sudo pip3 install openpyxl

After that, retry running your script (if you are running a Jupyter Notebook, be sure to restart the notebook to reload pandas!).

If the error still persists, you have two choices:

Choice 1 (preferred): Update pandas

Pandas 1.1.3 doesn’t automatically select the correct XLSX reader engine, but pandas 1.3.1 does:

sudo pip3 install --upgrade pandas

If you are running a Jupyter Notebook, be sure to restart the notebook to load the updated pandas version!

Choice 2: Explicitly set the engine in pd.read_excel()

Add engine='openpyxl' to your pd.read_excel() command, for example:

pd.read_excel('my.xlsx', engine='openpyxl')


Posted by Uli Köhler in pandas, Python

How to add pandas pd.Timestamp

You can’t directly add Pandas pd.Timestamp instances:

t1 = pd.Timestamp('now')
t2 = pd.Timestamp('now')

t1 + t2
# TypeError: unsupported operand type(s) for +: 'Timestamp' and 'Timestamp'

But you can convert them to a numpy timestamp using their asm8 attribute, convert that timestamp to an integer, add it and convert it back:

t1 = pd.Timestamp('now')
t2 = pd.Timestamp('now')

tsum = (t1.asm8.astype(np.int64) + t2.asm8.astype(np.int64))
tsum_timestamp = pd.Timestamp(tsum.astype('<M8[ns]'))


Posted by Uli Köhler in pandas, Python

How to get average or mean between two pandas pd.Timestamp objects?

In order to compute the mean value between two pd.Timestamp instances, subtract them to obtain a pd.Timedelta and then add said Timedelta object to the first (smaller) timestamp:

t1 = pd.Timestamp('now')
t2 = pd.Timestamp('now')

mean_timestamp = t1 + ((t2 - t1) / 2)


Posted by Uli Köhler in pandas, Python

How to suppress legend in pandas .plot()

In order to suppress the legend when using pandas .plot(), use

legend=False

as an Argument to .plot(), for example:

df.plot(legend=False)


Posted by Uli Köhler in pandas, Python

How to fix pandas to_sql() AttributeError: ‘DataFrame’ object has no attribute ‘cursor’

Problem:

You are trying to save your DataFrame in an SQL database using pandas to_sql(), but you see an exception like

---------------------------------------------------------------------------
AttributeError                            Traceback (most recent call last)
<ipython-input-21-3788db1a4131> in <module>
      7 db = sqlalchemy.create_engine('sqlite:///timeseries.db' class="ansi-blue-fg">)
      8 
----> 9 df.to_sql('timeseries', df)

~/miniconda3/lib/python3.8/site-packages/pandas/core/generic.py in to_sql(self, name, con, schema, if_exists, index, index_label, chunksize, dtype, method)
   2603         from pandas.io import sql
   2604 
-> 2605         sql.to_sql(
   2606             self,
   2607             name,

~/miniconda3/lib/python3.8/site-packages/pandas/io/sql.py in to_sql(frame, name, con, schema, if_exists, index, index_label, chunksize, dtype, method)
    587         )
    588 
--> 589     pandas_sql.to_sql(
    590         frame,
    591         name,

~/miniconda3/lib/python3.8/site-packages/pandas/io/sql.py in to_sql(self, frame, name, if_exists, index, index_label, schema, chunksize, dtype, method)
   1825             dtype=dtype,
   1826         )
-> 1827         table.create()
   1828         table.insert(chunksize, method)
   1829 

~/miniconda3/lib/python3.8/site-packages/pandas/io/sql.py in create(self)
    719 
    720     def create(self):
--> 721         if self.exists():
    722             if self.if_exists == "fail":
    723                 raise ValueError(f"Table '{self.name}' already exists.")

~/miniconda3/lib/python3.8/site-packages/pandas/io/sql.py in exists(self)
    706 
    707     def exists(self):
--> 708         return self.pd_sql.has_table(self.name, self.schema)
    709 
    710     def sql_schema(self):

~/miniconda3/lib/python3.8/site-packages/pandas/io/sql.py in has_table(self, name, schema)
   1836         query = f"SELECT name FROM sqlite_master WHERE type='table' AND name={wld};"
   1837 
-> 1838         return len(self.execute(query, [name]).fetchall()) > 0
   1839 
   1840     def get_table(self, table_name, schema=None):

~/miniconda3/lib/python3.8/site-packages/pandas/io/sql.py in execute(self, *args, **kwargs)
   1677             cur = self.con
   1678         else:
-> 1679             cur = self.con.cursor()
   1680         try:
   1681             cur.execute(*args, **kwargs)

~/miniconda3/lib/python3.8/site-packages/pandas/core/generic.py in __getattr__(self, name)
   5137             if self._info_axis._can_hold_identifiers_and_holds_name(name):
   5138                 return self[name]
-> 5139             return object.__getattribute__(self, name)
   5140 
   5141     def __setattr__(self, name: str, value) -> None:

AttributeError: 'DataFrame' object has no attribute 'cursor'

Solution:

You’re calling to_sql() with the wrong arguments! The second argument needs to be the database connection (e.g. an sqlalchemy engine)! You’re probably calling it like this:

df.to_sql('timeseries', df)

but the second argument needs to be db (or whatever your database connection object is named), not df!

Full working example for to_sql()

import pandas as pd
# Load pre-built time series example dataset
df = pd.read_csv("https://datasets.techoverflow.net/timeseries-example.csv", parse_dates=["Timestamp"])
df.set_index("Timestamp", inplace=True)

import sqlalchemy
db = sqlalchemy.create_engine('sqlite:///timeseries.db')

df.to_sql('timeseries', db, if_exists="replace")
Posted by Uli Köhler in pandas, Python

How to export Pandas dataset to SQLite database

In our previous post we showed how to connect to an SQLite database using sqlalchemy.

In this blogpost, we’ll show how you can export a pandas DataFrame – for example, our time series example dataset – to the SQLite database.

First, we’ll load the example data frame:

import pandas as pd
# Load pre-built time series example dataset
df = pd.read_csv("https://datasets.techoverflow.net/timeseries-example.csv", parse_dates=["Timestamp"])
df.set_index("Timestamp", inplace=True)

Now we can open the SQLite database as shown in our previous post

import sqlalchemy
db = sqlalchemy.create_engine('sqlite:///timeseries.db')

and export the DataFrame to the database:

df.to_sql('timeseries', db, if_exists="replace")

I always recommend using if_exists="replace" (i.e. if the table already exists, replace it) for a quicker development process.

The database looks like this when viewed in an SQLite viewer like HeidiSQL:

Complete code example

import pandas as pd
# Load pre-built time series example dataset
df = pd.read_csv("https://datasets.techoverflow.net/timeseries-example.csv", parse_dates=["Timestamp"])
df.set_index("Timestamp", inplace=True)

import sqlalchemy
db = sqlalchemy.create_engine('sqlite:///timeseries.db')

df.to_sql('timeseries', db, if_exists="replace")


Posted by Uli Köhler in pandas, Python