Geography

How to compute distance and bearing of two points represented by Coordinate strings in Python

Problem:

You have to points represented by some coordinate string in Python:

a = "N 48° 06.112' E 11° 44.113'"
b = "N 48° 06.525' E 11° 44.251'"

and you want to compute both bearing and distance between them

Solution:

This can be done using a combination of two of our previous posts:

from geographiclib.geodesic import Geodesic
from geopy.geocoders import ArcGIS

geolocator = ArcGIS()

a = geolocator.geocode("N 48° 06.112' E 11° 44.113'")
b = geolocator.geocode("N 48° 06.525' E 11° 44.251'")

result = Geodesic.WGS84.Inverse(a.latitude, a.longitude, b.latitude, b.longitude)
distance = result["s12"] # in [m] (meters)
bearing = result["azi1"] # in [°] (degrees)

Result for our example:

distance = 784.3069649126435 # m
bearing = 12.613924599757134 # °
 

Posted by Uli Köhler in Geography, Python

How to compute distance and bearing between two lat/lon points in Python

Problem:

Let’s assume we have the following points represented by their latitude & longitude in Python:

a = (48.11617185, 11.743858785932662)
b = (48.116026149999996, 11.743938922310974)

and we want to compute both distance and bearing between those points on the WGS84 or any other Geoid of your choosing.

Solution:

We can use geographiclib to do that:

from geographiclib.geodesic import Geodesic

result = Geodesic.WGS84.Inverse(*a, *b)
distance = result["s12"] # in [m] (meters)
bearing = result["azi1"] # in [°] (degrees)

Geodesic.WGS84.Inverse(*a, *b) is just a shorthand for Geodesic.WGS84.Inverse(a[0], a[1], b[0], b[1]), so don’t be too confused by the syntax.

Using our example coordinates from above result is

{'lat1': 48.11617185,
 'lon1': 11.743858785932662,
 'lat2': 48.116026149999996,
 'lon2': 11.743938922310974,
 'a12': 0.00015532346032069415,
 's12': 17.26461706032189,
 'azi1': 159.78110567187977,
 'azi2': 159.7811653333465}

Therefore,

distance = 17.26461706032189 # m
bearing = 159.78110567187977 # °
Posted by Uli Köhler in Geography, Python

How to parse any lat/lon string in Python using GeoPy

When working with user-entered coordinates, you often have strings like N 48° 06.976 E 11° 44.638, 48°06'58.6"N 11°44'38.3"E or N48.116267, E11.743967. These lan/lon coordinates come in many, many different formats which makes it rather hard to parse in an automated setting.

One simple solution for Python is to use geopy which provides access to a bunch of Online services such as ArcGIS. These services make it easy to parse pretty much any form of coordinate. You can install geopy using

pip install geopy

Note that Nominatim does not work for the pure coordinates use case – it parses the coordinates just fine but will return the closest building / address.

from geopy.geocoders import ArcGIS

geolocator = ArcGIS()

result = geolocator.geocode("N 48° 06.976' E 11° 44.638'")

In case the coordinates can’t be parsed, result will be None

After that, you can work with result, for example, in the following ways:

print(result) will just print the result:

>>> print(result)
Location(Y:48.116267 X:11.743967, (48.11626666666667, 11.743966666666667, 0.0))

You can extract the latitude and longitude using result.latitude and result.longitude.

>>> print(result.latitude, result.longitude)
(48.11626666666667, 11.743966666666667)

For other ways to work with these coordinates, refer to the geopy documentation.

Posted by Uli Köhler in Geography, Python

How to filter OpenStreetmap nodes by tag from .osm.pbf file using Python & Osmium

In our previous post Minimal example how to read .osm.pbf file using Python & osmium we investigated how to read a .osm.pbf file and count all nodes, ways and relations.

Today, we’ll investigate how to filter for specific nodes by tag using osmium working on .osm.pbf files. In this example, we’ll filter for power: tower and count how many nodes we can find

#!/usr/bin/env python3
import osmium as osm

class FindPowerTowerHandler(osm.SimpleHandler):
    def __init__(self):
        osm.SimpleHandler.__init__(self)
        self.count = 0

    def node(self, node):
        if node.tags.get("power") == "tower":
            self.count += 1

osmhandler = FindPowerTowerHandler()
osmhandler.apply_file("germany-latest.osm.pbf")

print(f'Number of power=tower nodes: {osmhandler.node_count}')

Also see How to filter OpenStreetmap ways by tag from .osm.pbf file using Python & Osmium

Posted by Uli Köhler in Geography, OpenStreetMap, Python

Minimal leaflet.js example with Stamen terrain tiles

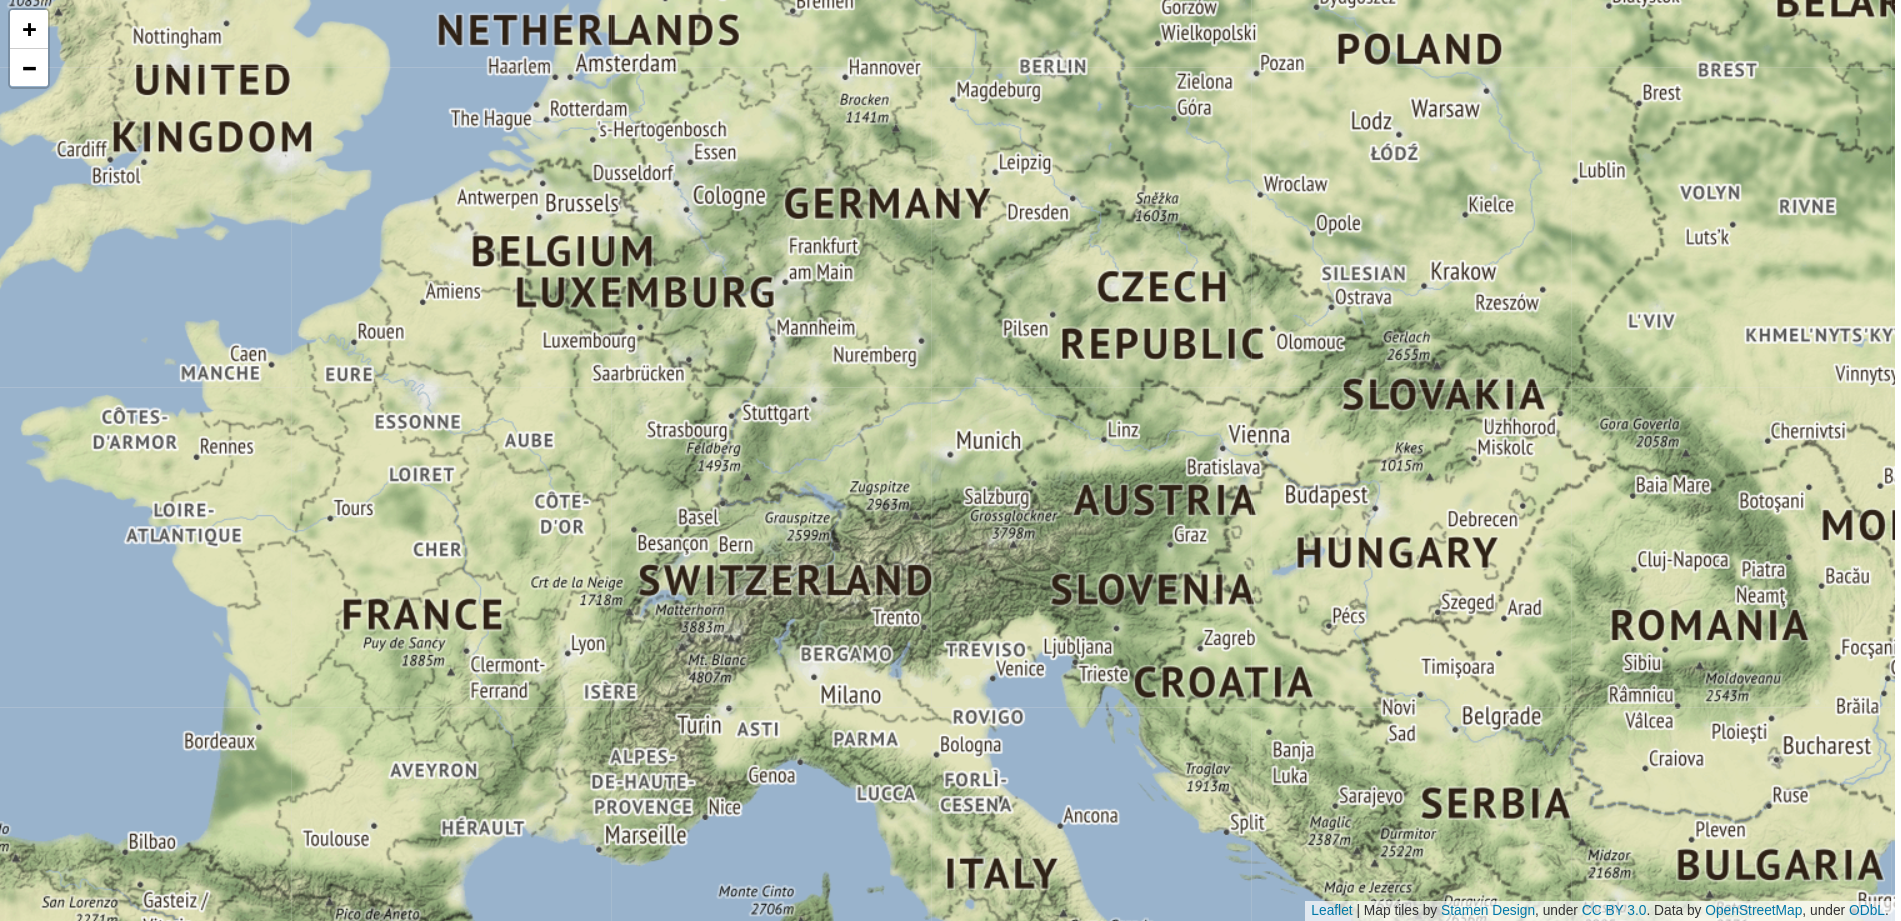
This minimal self-contained HTML example can serve as a good starting point for your own leaflet application. Using Stamen Terrain tiles not only provides a nice view of the physical geography but has the added advantage of not requiring any API key.

<html>
    <head>
        <link rel="stylesheet" href="https://unpkg.com/[email protected]/dist/leaflet.css"
        integrity="sha512-xodZBNTC5n17Xt2atTPuE1HxjVMSvLVW9ocqUKLsCC5CXdbqCmblAshOMAS6/keqq/sMZMZ19scR4PsZChSR7A=="
        crossorigin=""/>
        <script src="https://unpkg.com/[email protected]/dist/leaflet.js"
        integrity="sha512-XQoYMqMTK8LvdxXYG3nZ448hOEQiglfqkJs1NOQV44cWnUrBc8PkAOcXy20w0vlaXaVUearIOBhiXZ5V3ynxwA=="
        crossorigin=""></script>
        <script type="text/javascript" src="https://stamen-maps.a.ssl.fastly.net/js/tile.stamen.js?v1.3.0"></script>
        <style>
            #mymap { height: 100%; }
        </style>
    </head>
    <body>
        <div id="mymap"></div>
        <script type="text/javascript">
            var layer = new L.StamenTileLayer("terrain");
            var map = new L.Map("mymap", {
                /* Center: Munich, Germany */
                center: new L.LatLng(48.1, 11.5),
                /* Show most of western Europe */
                zoom: 6
            });
            map.addLayer(layer);
        </script>
    </body>
</html>

Look and feel of the example:

Posted by Uli Köhler in HTML, Javascript, Leaflet

How to filter OpenStreetmap ways by tag from .osm.pbf file using Python & Osmium

In our previous post Minimal example how to read .osm.pbf file using Python & osmium we investigated how to read a .osm.pbf file and count all nodes, ways and relations.

Today, we’ll investigate how to filter for specific ways by tag using osmium working on .osm.pbf files. In this example, we’ll filter by highwaytrunk

#!/usr/bin/env python3
import osmium as osm
from collections import namedtuple
import itertools

Way = namedtuple("Way", ["id", "nodes", "tags"])

class FindHighwayTrunks(osm.SimpleHandler):
    """
    Find ways with "highway: trunk" tag
    """

    def __init__(self):
        osm.SimpleHandler.__init__(self)
        self.ways = []

    def way(self, way):
        # If this way is a highway: trunk, ...
        if way.tags.get("highway") == "trunk":
            # ... add it to self.ways
            # NOTE: We may not keep a reference to the way object,
            # so we have to create a new Way object
            nodes = [node.ref for node in way.nodes]
            self.ways.append(Way(way.id, nodes, dict(way.tags)))

# Find ways with the given tag
way_finder = FindHighwayTrunks()
way_finder.apply_file("kenya-latest.osm.pbf")

print(f"Found {len(way_finder.ways)} ways")

This example uses kenya-latest.osm.pbf downloaded from Geofabrik, but you can use any .osm.pbf file. Parsing said file takes about 10 seconds on my Desktop.

Note that we can’t just self.ways.append(way) because way is a temporary/internal Protobuf object and may not be used directly since. Hence, we create our own object that just wraps the extracted contents of way: Its id, its list of nodes (node IDs) and a dictionary containing the tags. Otherwise, you’ll see this error message:

Traceback (most recent call last):
  File "run.py", line 32, in <module>
    trunk_handler.apply_file("kenya-latest.osm.pbf")
RuntimeError: Way callback keeps reference to OSM object. This is not allowed.
Posted by Uli Köhler in Geography, Geoinformatics, OpenStreetMap, Python

How to get bounding box of a country using Natural Earth data and Cartopy

In this example, we’ll determine the bounding box of Kenya using the public domain Natural Earth dataset and the Cartopy library.

Rendering just the bounding box of Kenya (with the actual country being highlighted in green) looks like this:

How to get the bounding box

First we use Cartopy’s cartopy.io.shapereader.natural_earth() function that will automatically download Natural Earth data (if it has already been downloaded, the cached data will be used):

shpfilename = shpreader.natural_earth(resolution='10m',
                                      category='cultural',
                                      name='admin_0_countries')
reader = shpreader.Reader(shpfilename)

Now we can filter for Kenya just like we did in our previous post on How to highlight a specific country using Cartopy:

kenya = [country for country in reader.records() if country.attributes["NAME_LONG"] == "Kenya"][0]

and get the bounding box using kenya.bounds:

lon_min, lat_min, lon_max, lat_max = kenya.bounds

Complete example code

This code will render the image shown above:

import cartopy.crs as ccrs
import cartopy.feature as cf
from cartopy.feature import ShapelyFeature
from matplotlib import pyplot as plt

proj = ccrs.PlateCarree()
ax = plt.axes(projection=proj)
# Show only Africa
#ax.set_extent([-23, 55, -35, 40])
ax.stock_img()

ax.add_feature(cf.COASTLINE, lw=2)
# Make figure larger
plt.gcf().set_size_inches(20, 10)

import cartopy.io.shapereader as shpreader
# Read shape file
shpfilename = shpreader.natural_earth(resolution='10m',
                                      category='cultural',
                                      name='admin_0_countries')
reader = shpreader.Reader(shpfilename)
# Filter for a specific country
kenya = [country for country in reader.records() if country.attributes["NAME_LONG"] == "Kenya"][0]
# Determine bounding box
lon_min, lat_min, lon_max, lat_max = kenya.bounds
ax.set_extent([lon_min, lon_max, lat_min, lat_max])

# Display Kenya's shape
shape_feature = ShapelyFeature([kenya.geometry], ccrs.PlateCarree(), facecolor="lime", edgecolor='black', lw=1)
ax.add_feature(shape_feature)

# Save figure as SVG
plt.savefig("Kenya-Bounding-Box-Tight.svg")


Posted by Uli Köhler in Cartopy, Geography, Python

How to plot Shapefile data in Cartopy

In order to display shapefile data in Cartopy, we can first use the cartopy.io.shapereader package to read the shape data and then convert the geometry we want to display to a cartopy.feature.ShapelyFeature.

In the following example, we’ll read the Natural Earth ne_110m_admin_0_countries.shp and
Note that there’s an easier way to plot Natural Earth data using shpreader.natural_earth – see How to highlight a specific country using Cartopy and we’ll use the Natural Earth dataset just as an example!

import cartopy.io.shapereader as shpreader
# Read shape file
reader = shpreader.Reader("ne_110m_admin_0_countries.shp")
# Filter for a specific country
kenya = [country for country in reader.records() if country.attributes["NAME_LONG"] == "Kenya"][0]

# Display Kenya's shape
shape_feature = ShapelyFeature([kenya.geometry], ccrs.PlateCarree(), facecolor="lime", edgecolor='black', lw=1)
ax.add_feature(shape_feature)

Complete code example

import cartopy.crs as ccrs
import cartopy.feature as cf
from cartopy.feature import ShapelyFeature
from matplotlib import pyplot as plt

proj = ccrs.PlateCarree()
ax = plt.axes(projection=proj)
# Show only Africa
ax.set_extent([-23, 55, -35, 40])
ax.stock_img()

ax.add_feature(cf.COASTLINE, lw=2)
# Make figure larger
plt.gcf().set_size_inches(20, 10)

import cartopy.io.shapereader as shpreader
# Read shape file
reader = shpreader.Reader("ne_110m_admin_0_countries.shp")
# Filter for a specific country
kenya = [country for country in reader.records() if country.attributes["NAME_LONG"] == "Kenya"][0]

# Display Kenya's shape
shape_feature = ShapelyFeature([kenya.geometry], ccrs.PlateCarree(), facecolor="lime", edgecolor='black', lw=1)
ax.add_feature(shape_feature)

# Save figure as SVG
plt.savefig("Africa-Highlight-Kenya.svg")
Posted by Uli Köhler in Cartopy, Geography, Python

How to highlight a specific country using Cartopy

In our previous posts, e.g. How to draw Africa map using Cartopy we showed how to draw an overview map of an entire continent using Cartopy. This post provides an example of how to highlight a specific country in that map. In this example, we’ll highlight Kenya

The general approach is:

  1. Use cartopy.io.shapereader.natural_earth to download Natural Earth data that contains the shape of Kenya
  2. Convert it to a cartopy.feature.ShapelyFeature
  3. Display said feature

Displaying Kenya’s Natural Earth shape in cartopy

First, we create a Reader for the Natural Earth data. Cartopy will automatically download the data if it has not been cached.

import cartopy.io.shapereader as shpreader

shpfilename = shpreader.natural_earth(resolution='110m',
                                      category='cultural',
                                      name='admin_0_countries')
reader = shpreader.Reader(shpfilename)

Now we can select Kenya by name from the records:

kenya = [country for country in reader.records() if country.attributes["NAME_LONG"] == "Kenya"][0]

In order to display that geometry, we use

shape_feature = ShapelyFeature([kenya.geometry], ccrs.PlateCarree(), facecolor="lime", edgecolor='black', lw=1)
ax.add_feature(shape_feature)

Complete example code

import cartopy.crs as ccrs
import cartopy.feature as cf
from cartopy.feature import ShapelyFeature
from matplotlib import pyplot as plt

proj = ccrs.PlateCarree()
ax = plt.axes(projection=proj)
# Show only Africa
ax.set_extent([-23, 55, -35, 40])
ax.stock_img()

ax.add_feature(cf.COASTLINE, lw=2)
# Make figure larger
plt.gcf().set_size_inches(20, 10)

# Read Natural Earth data
import cartopy.io.shapereader as shpreader

shpfilename = shpreader.natural_earth(resolution='110m',
                                      category='cultural',
                                      name='admin_0_countries')
reader = shpreader.Reader(shpfilename)
kenya = [country for country in reader.records() if country.attributes["NAME_LONG"] == "Kenya"][0]

# Display Kenya's shape
shape_feature = ShapelyFeature([kenya.geometry], ccrs.PlateCarree(), facecolor="lime", edgecolor='black', lw=1)
ax.add_feature(shape_feature)

# Save figure as SVG
plt.savefig("Africa-Highlight-Kenya.svg")


Posted by Uli Köhler in Cartopy, Geography, Python

How to draw Europe map using Cartopy

We can easily draw an Africa Map using Cartopy by setting the extents to [-13, 45, 30, 70]:

ax.set_extent([-13, 45, 30, 70])

Complete code example

The code above produces the image shown above:

import cartopy.crs as ccrs
import cartopy.feature as cf
from matplotlib import pyplot as plt

proj = ccrs.Miller()
ax = plt.axes(projection=proj)
ax.set_extent([-13, 45, 30, 70])
ax.stock_img()

ax.add_feature(cf.COASTLINE, lw=2)
ax.add_feature(cf.BORDERS)
# Make figure larger
plt.gcf().set_size_inches(20, 10)

# Save figure as SVG
plt.savefig("Europe.svg")


Posted by Uli Köhler in Cartopy, Geography, Python

How to make Cartopy coastline or border lines thicker (line width)

By standard, Cartopy draws every feature with the same line width:

ax.add_feature(cf.COASTLINE)
ax.add_feature(cf.BORDERS)

We can easily increasing the line width by adding e.g. lw=2 to the ax.add_feature() call:

ax.add_feature(cf.COASTLINE, lw=2)
ax.add_feature(cf.BORDERS)

Complete code example

This example produces the image with a wider coast line line width as shown above

import cartopy.crs as ccrs
import cartopy.feature as cf
from matplotlib import pyplot as plt

proj = ccrs.PlateCarree()
ax = plt.axes(projection=proj)
ax.set_extent([-23, 55, -35, 40])
ax.stock_img()

ax.add_feature(cf.COASTLINE, lw=2)
ax.add_feature(cf.BORDERS)
# Make figure larger
plt.gcf().set_size_inches(20, 10)

# Save figure as SVG
plt.savefig("Africa-Standard.svg")


Posted by Uli Köhler in Cartopy, Geography, Python

How to draw Africa map using Cartopy

We can easily draw an Africa Map using Cartopy by setting the extents to [-23, 55, -35, 40]:

ax.set_extent([-23, 55, -35, 40])

Complete code example

The code above produces the image shown above:

import cartopy.crs as ccrs
import cartopy.feature as cf
from matplotlib import pyplot as plt

proj = ccrs.PlateCarree()
ax = plt.axes(projection=proj)
ax.set_extent([-23, 55, -35, 40])
ax.stock_img()

ax.add_feature(cf.COASTLINE, lw=2)
ax.add_feature(cf.BORDERS)
# Make figure larger
plt.gcf().set_size_inches(20, 10)

# Save figure as SVG
plt.savefig("Africa.svg")


Posted by Uli Köhler in Cartopy, Geography, Python

How to draw straight line between two coordinates using Cartopy

In our previous posts Minimal Geodetic example using Cartopy and How to increase Geodetic resolution / accuracy / smoothness in Cartopy we have shown how to create a geodetic line on a map. While a geodetic is defined to be the shortest line on the Earth’s surface, it is not a straight line on a map projection.

In order to plot a geodetic we use:

plt.plot([lon1, lon2], [lat1, lat2], transform=ccrs.Geodetic())

In order to plot a straight line, we need to use the same projection as we used to create the map instead of transform=ccrs.Geodetic().

For example, if we created the map using

plt.axes(projection=ccrs.PlateCarree())

we need to plot the line using transform=ccrs.PlateCarree()

plt.plot([lon1, lon2], [lat1, lat2], transform=ccrs.PlateCarree())

In order to avoid errors, I strongly recommend using just one instance of the projection and assigning it to a common variable, for example:

proj = ccrs.PlateCarree()
ax = plt.axes(projection=proj)
plt.plot([-75, 77.23], [43, 28.61], transform=proj)

Note that for reasons currently unknown to me at the moment, this only works for some projections at the moment. Using ccrs.PlateCarree() and ccrs.Miller() works, but using ccrs.Mollweide() does not work!

Complete example

This code reproduces the image shown above:

import cartopy.crs as ccrs
import cartopy.feature as cf
from matplotlib import pyplot as plt

proj = ccrs.PlateCarree()
ax = plt.axes(projection=proj)
ax.stock_img()
ax.add_feature(cf.BORDERS)
# Add straight line between two points
# Format: plot([lon1, lon2], [lat1, lat2])
plt.plot([-75, 77.23], [43, 28.61], linestyle='--',
         color='blue', linewidth=8,
         transform=proj)
# Make figure larger
plt.gcf().set_size_inches(20, 10)

# Save figure as SVG
plt.savefig("Cartopy-Straight-Line-PlateCarree.svg")


Posted by Uli Köhler in Cartopy, Geography, Python

How to increase Geodetic resolution / accuracy / smoothness in Cartopy

In our previous post we have detailed how to draw a geodetic in Cartopy. However, as you can see in the resulting map, the geodetic line is broken up into several clearly visible segments:

In order to fix that, we need to subclass the original projection of the plot. In this example, we’re subclassing ccrs.Mollweide():

import cartopy.crs as ccrs

class HighResMollweide(ccrs.Mollweide):
    @property
    def threshold(self): return 100.0

Note that the default threshold for the Mollweide projection is 100000.0 – you can check for yourself using print(ccrs.Mollweide().threshold)

Now we can use that projection in plt.axes():

ax = plt.axes(projection=HighResMollweide())

Complete example code

This code reproduced the high-resolution geodetic image shown above:

import cartopy.crs as ccrs
import cartopy.feature as cf
from matplotlib import pyplot as plt

class HighResMollweide(ccrs.Mollweide):
    @property
    def threshold(self): return 100.0

ax = plt.axes(projection=HighResMollweide())
ax.stock_img()
ax.add_feature(cf.BORDERS)
# Add geodetic between two points
# Format: plot([lon1, lon2], [lat1, lat2])
plt.plot([-75, 77.23], [43, 28.61],
         color='blue', linewidth=2,
         transform=ccrs.Geodetic()
         )
# Make figure larger
plt.gcf().set_size_inches(20, 10)

# Save figure as SVG
plt.savefig("Cartopy-Geodetic-HiRes.svg")

Thanks to @ajdawson on StackOverflow for the original hint on how to solve this!

Posted by Uli Köhler in Cartopy, Geography, Python

Minimal Geodetic example using Cartopy

This minimal example shows you how to plot a geodetic line between two points. It is closely based on the cartopy with matplotlib intro.

import cartopy.crs as ccrs
import cartopy.feature as cf
from matplotlib import pyplot as plt
ax = plt.axes(projection = ccrs.Mollweide())
ax.stock_img()
ax.add_feature(cf.BORDERS)
# Add geodetic between two points
# Format: plot([lon1, lon2], [lat1, lat2])
plt.plot([-75, 77.23], [43, 28.61],
         color='blue', linewidth=2,
         transform=ccrs.Geodetic()
         )


Complete example code

This code reproduces the image shown above:

import cartopy.crs as ccrs
import cartopy.feature as cf
ax = plt.axes(projection = ccrs.Mollweide())
ax.stock_img()
ax.add_feature(cf.BORDERS)
# Add geodetic between two points
# Format: plot([lon1, lon2], [lat1, lat2])
plt.plot([-75, 77.23], [43, 28.61],
         color='blue', linewidth=2,
         transform=ccrs.Geodetic()
         )
# Make figure larger
plt.gcf().set_size_inches(20, 10)

# Save figure as SVG
plt.savefig("Cartopy-Geodetic.svg")


Posted by Uli Köhler in Cartopy, Geography, Python

How to add colored background to Cartopy map

Want to get from this black and white map

to this colored map

in just one line of code? Simply use cartopy’s stock_img():

ax.stock_img()

Complete example code

import cartopy.crs as ccrs
import cartopy.feature as cf
from matplotlib import pyplot as plt
ax = plt.axes(projection = ccrs.Mollweide())
ax.stock_img()
ax.add_feature(cf.COASTLINE)
ax.add_feature(cf.BORDERS)
# Make figure larger
plt.gcf().set_size_inches(20, 10)

# Save figure as SVG
plt.savefig("Cartopy-Colored.svg")

Posted by Uli Köhler in Cartopy, Geography, Python

How to draw country borders in Cartopy

Use

import cartopy.crs as ccrs
import cartopy.feature as cf
from matplotlib import pyplot as plt
ax = plt.axes(projection = ccrs.Mercator())
# This will add borders
ax.add_feature(cf.BORDERS)

The following code shows you a minimal example of how to plot country borders (and coastlines) using cartopy:

import cartopy.crs as ccrs
import cartopy.feature as cf
ax = plt.axes(projection = ccrs.Mercator())
ax.add_feature(cf.COASTLINE)
ax.add_feature(cf.BORDERS)
# Make figure larger
plt.gcf().set_size_inches(20, 10)

# Save figure as SVG
plt.savefig("Cartopy-Borders.svg")

Posted by Uli Köhler in Cartopy, Geography, Python

Cartopy minimal example with Coastlines

This example shows you a minimal example of how to plot coastlines using cartopy:

import cartopy.crs as ccrs
import cartopy.feature as cf
from matplotlib import pyplot as plt
ax = plt.axes(projection = ccrs.Mercator())
ax.add_feature(cf.COASTLINE)
# Make figure larger
plt.gcf().set_size_inches(20, 10)

# Save figure as SVG
plt.savefig("Cartopy-Coastlines.svg")

Posted by Uli Köhler in Cartopy, Geography, Python

How to draw Africa-focused map using matplotlib basemap

Note that matplotlib basemap is deprecated in favour of cartopy !

Also see:

This code allows you to draw an map that is focused on Africa using matplotlib basemap:

my_map = Basemap(projection='ortho', lat_0=10, lon_0=13, resolution='l')

Complete example code

This code reproduces the image shown above:

from mpl_toolkits.basemap import Basemap
import matplotlib.pyplot as plt
my_map = Basemap(projection='ortho', lat_0=10, lon_0=13, resolution='l')
my_map.drawcoastlines(linewidth=1)
my_map.drawcountries(linewidth=0.5)

# Make plot larger
plt.gcf().set_size_inches(20, 10)
# Save to file
plt.savefig("Africa.svg")


Posted by Uli Köhler in Geography, Python

How to draw Europe-focused map using matplotlib basemap

Also see:

This code allows you to draw an map that is focused on Europe using matplotlib basemap:

my_map = Basemap(projection='ortho', lat_0=55, lon_0=13, resolution='l')

Complete example code

This code reproduces the image shown above:

from mpl_toolkits.basemap import Basemap
import matplotlib.pyplot as plt
my_map = Basemap(projection='ortho', lat_0=55, lon_0=13, resolution='l')
my_map.drawcoastlines(linewidth=1)
my_map.drawcountries(linewidth=0.5)

# Make plot larger
plt.gcf().set_size_inches(20, 10)
# Save to file
plt.savefig("Europe.svg")


Posted by Uli Köhler in Geography, Python