In Jupyter,
import sys
sys.path[0]
will not return the directory where the notebook file resides but something like
/usr/lib/python310.zip
Instead, use
import os.path

os.path.dirname(os.path.realpath("__file__"))In Jupyter,
import sys sys.path[0]
will not return the directory where the notebook file resides but something like
/usr/lib/python310.zip
Instead, use
import os.path
os.path.dirname(os.path.realpath("__file__"))You are trying to plot a pandas DataFrame or Series using code such as
df.plot()
but you see an error message like
Traceback (most recent call last):
  ...
  File "/usr/local/lib/python3.11/site-packages/matplotlib/figure.py", line 3390, in savefig
    self.canvas.print_figure(fname, **kwargs)
  File "/usr/local/lib/python3.11/site-packages/matplotlib/backend_bases.py", line 2164, in print_figure
    self.figure.draw(renderer)
  File "/usr/local/lib/python3.11/site-packages/matplotlib/artist.py", line 95, in draw_wrapper
    result = draw(artist, renderer, *args, **kwargs)
             ^^^^^^^^^^^^^^^^^^^^^^^^^^^^^^^^^^^^^^^
  File "/usr/local/lib/python3.11/site-packages/matplotlib/artist.py", line 72, in draw_wrapper
    return draw(artist, renderer)
           ^^^^^^^^^^^^^^^^^^^^^^
  File "/usr/local/lib/python3.11/site-packages/matplotlib/figure.py", line 3154, in draw
    mimage._draw_list_compositing_images(
  File "/usr/local/lib/python3.11/site-packages/matplotlib/image.py", line 132, in _draw_list_compositing_images
    a.draw(renderer)
  File "/usr/local/lib/python3.11/site-packages/matplotlib/artist.py", line 72, in draw_wrapper
    return draw(artist, renderer)
           ^^^^^^^^^^^^^^^^^^^^^^
  File "/usr/local/lib/python3.11/site-packages/matplotlib/axes/_base.py", line 3034, in draw
    self._update_title_position(renderer)
  File "/usr/local/lib/python3.11/site-packages/matplotlib/axes/_base.py", line 2969, in _update_title_position
    bb = ax.xaxis.get_tightbbox(renderer)
  File "/usr/local/lib/python3.11/site-packages/matplotlib/axis.py", line 1334, in get_tightbbox
    ticks_to_draw = self._update_ticks()
  File "/usr/local/lib/python3.11/site-packages/matplotlib/axis.py", line 1276, in _update_ticks
    major_labels = self.major.formatter.format_ticks(major_locs)
  File "/usr/local/lib/python3.11/site-packages/matplotlib/ticker.py", line 216, in format_ticks
    return [self(value, i) for i, value in enumerate(values)]
  File "/usr/local/lib/python3.11/site-packages/matplotlib/ticker.py", line 216, in <listcomp>
    return [self(value, i) for i, value in enumerate(values)]
  File "/usr/local/lib/python3.11/site-packages/matplotlib/dates.py", line 649, in __call__
    result = num2date(x, self.tz).strftime(self.fmt)
  File "/usr/local/lib/python3.11/site-packages/matplotlib/dates.py", line 543, in num2date
    return _from_ordinalf_np_vectorized(x, tz).tolist()
  File "/usr/local/lib/python3.11/site-packages/numpy/lib/function_base.py", line 2372, in __call__
    return self._call_as_normal(*args, **kwargs)
  File "/usr/local/lib/python3.11/site-packages/numpy/lib/function_base.py", line 2365, in _call_as_normal
    return self._vectorize_call(func=func, args=vargs)
  File "/usr/local/lib/python3.11/site-packages/numpy/lib/function_base.py", line 2455, in _vectorize_call
    outputs = ufunc(*inputs)
  File "/usr/local/lib/python3.11/site-packages/matplotlib/dates.py", line 362, in _from_ordinalf
    raise ValueError(f'Date ordinal {x} converts to {dt} (using
This issue has been discussed on the Matplotlib Github and also pandas Github. This issue occurs if you use df.plot() but then set custom formatting options for the x axis, for datetime index DataFrames.
Right now you can work around this bug by manually plotting the data:
for column in df.columns:
    plt.plot(df.index.values, df[column].values, label=column)
instead, but keep in mind that you might need to set some matplotlib options yourself (which pandas would otherwise set automatically) when plotting everything manually.
This example shows how to differentiate between a Part with this Part Number already exists error and other errors for inventree Part.create(). Any other error is simply re-raised. See Inventree Python API: How to create a new part
try:
    part = Part.create(api, {
        'name': product.mpn,
        'description': product.description,
        'category': get_part_category_by_pathstring(api, "Elektronik-Komponenten").pk,
    })
except requests.exceptions.HTTPError as ex:
    errmsg, = ex.args
    # NOTE: errmsg is a dictionary with the following keys
    # errmsg["detail"] == "Error occurred during API request"
    # errmsg["data"] == {'name': 'VHR-4N-BK', 'description': '...', ...}
    # errmsg["params"] == {'format': 'json'}
    # errmsg["body"] == "{'non_field_erro   rs': ['Part with this Part Number already exists.']}""

    body = json.loads(errmsg.get("body", []))
    non_field_errors = body.get("non_field_errors", [])
    # If there is a non field error and it contains "Part with this ... already exists",
    if len(non_field_errors) > 0 and re.match(r"Part with this .* already exists", non_field_errors[0]):
        print("This part already exists")
    else:
        raise ex
response = httpx.post("https://my.domain/api/redirect")
# Get redirect location
if response.has_redirect_location:
    redirect_location = response.headers['Location']
else:
    redirect_location = None
In Python, you’re using code such as
from functools import lru_cache

@lru_cache(max_size=128)
def myfunc(arg: str):
   # ...
   return arg + "x"
but you see an error message such as
Traceback (most recent call last):
  File "/dev/shm/test.py", line 3, in <module>
    @lru_cache(max_size=128)
TypeError: lru_cache() got an unexpected keyword argument 'max_size'You’ve mis-spelled the argument to @lru_cache: You wrote max_size with underscore whereas it actually is maxsize without underscore.
You can use df.iterrows() normally:
import pandas as pd
import numpy as np

# Assuming 'df' is your DataFrame
# For demonstration, let's create a sample DataFrame
dates = pd.date_range('2023-01-01', periods=5)
data = np.random.randn(5, 2)
df = pd.DataFrame(data, index=dates, columns=['A', 'B'])

# Iterating over rows
for index, row in df.iterrows():
    print(f"Index: {index}, A: {row['A']}, B: {row['B']}")
Note that index is a pd.Timestamp.
import pandas as pd
import numpy as np

# Create a sample DataFrame with datetime index
dates = pd.date_range('2023-01-01', periods=10)
data = np.random.randn(10, 2)
df = pd.DataFrame(data, index=dates, columns=['A', 'B'])

# Timestamps to drop
timestamps_to_drop = [pd.Timestamp('2023-01-03'), pd.Timestamp('2023-01-05'), pd.Timestamp('2023-01-07'),
                      pd.Timestamp('2023-01-08'), pd.Timestamp('2023-01-10')]

# Drop rows
df_filtered = df.drop(index=timestamps_to_drop)
When trying to run a PySpice program, you see an error message such as
OSError: cannot load library 'libngspice.so': libngspice.so: cannot open shared object file: No such file or directory. Additionally, ctypes.util.find_library() did not manage to locate a library called 'libngspice.so'
Install libngspice, often called libngspice0.
On Ubuntu, install it using
sudo apt -y install libngspice0-dev
You need to install the -dev library since libngspice0 only contains libngspice.so.0 whereas the -dev library contains libngspice.so which is required by pyspice.
When compiling your Hugo page, you see an error message such as
ERROR render of "section" failed: "/home/uli/klc/themes/hugo-theme-techdoc/layouts/_default/list.html:3:4": execute of template failed: template: _default/list.html:3:4: executing "main" at <.Content>: error calling Content: "/home/uli/klc/content/footprint/F2/_index.adoc:1:1": access denied: "asciidoctor" is not whitelisted in policy "security.exec.allow"; the current security configuration is:
You need to edit your Hugo configuration file and add asciidoctor or whatever program caused the error, to the list of allowed programs to execute.
For TOML config files, add the following section which consists of the default value plus asciidoctor
[security]
    [security.exec]
    allow = ['^(dart-)?sass(-embedded)?$', '^go$', '^npx$', '^postcss$', '^asciidoctor$']
After that, recompile your Hugo page.
You want to use cache3‘s SafeCache as shown in the Quickstart
from cache3 import SafeCache
cache = SafeCache()
but you instead see the following error message:
ImportError: cannot import name 'SafeCache' from 'cache3' (/usr/local/lib/python3.10/dist-packages/cache3/__init__.py)
cache3 has been updated, but the documentation still has not been fixed. This is a known bug.
The closest equivalent is Cache() with thread_safe=True, an in-memory cache which supports tagging:
from cache3 import Cache
cache = Cache(name="mycache", thread_safe=True)
In case you don’t need tagging, consider MiniCache:
from cache3 import MiniCache
cache = MiniCache(name="mycache", thread_safe=True)
When you try to run your PySpice script, you see an error log such as
PySpice.Spice.NgSpice.Shared.NgSpiceShared._send_char - WARNING - spinit was not found
PySpice.Spice.NgSpice.Shared.NgSpiceShared._send_char - ERROR - Note: can't find init file.
PySpice.Spice.NgSpice.Shared.NgSpiceShared._init_ngspice - WARNING - Unsupported Ngspice version 36
Your PySpice is too new for the ngspice version installed on your system.
Typically, it’s easiest to install a slightly older PySpice version:
sudo pip3 install -U "pyspice<1.5"
(but you can also update your ngspice).
python3 -c "import urllib.request; urllib.request.urlretrieve('https://bootstrap.pypa.io/get-pip.py', 'get-pip.py')"
python3 get-pip.py --break-system-packages
You can use the UliEngineering library to compute the power lost to charging a particular MOSFET to a particular gate voltage a given number of times a second:
from UliEngineering.Electronics.MOSFET import mosfet_gate_charge_losses
from UliEngineering.EngineerIO import auto_format

auto_format(mosfet_gate_charge_losses, "31nC", "9V", "1MHz")
# Prints '279 mW'
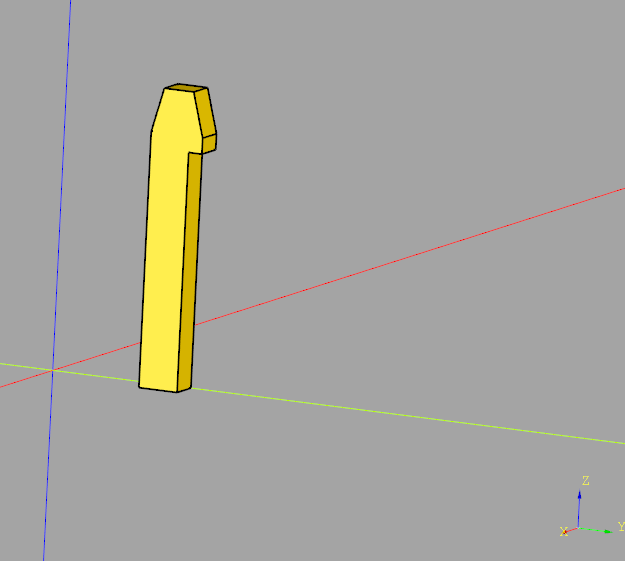
import cadquery as cq
import math

# Set parameters
n = 2 # Number of pins
P = 3.96 # mm pin pitch
C1 = 6.8 # mm Height of bottom plate
H1 = 9.4 # mm Height of latching plate
O1 = 2 # mm Vertical offset pin-center to bottom plate border
D1 = 3.2 # mm Total depth of bottom plate
Pw = 1.14 # mm Width & height of square pin
D2 = 1.3 # mm (Measured) depth of latching plate (narrowest section)
Wx1 = 1.0 # mm (Measured) Width of the topmost part of the latching plate
Hx1 = 0.5 # mm (Measured) Height of the latching surface facing away from the pins
alpha = 90 # ° Angle of the latching surface. Shown by the datasheet as ~45°but real parts have 90°
beta = 15 # ° (Estimated) Latching plate tapering angle
WL1 = 1.27 # mm (Measured) With of the section of the bottom plate where there is no latching plate per side)
Dlatch = 1.75 # mm (Measured) Total depth of latching plate
delta = 70 # ° (Estimated) Taper angle of the pin top & bottoms
FilletRadiusBaseplate = 0.4 # mm

# Compute derived variables
A1 = ( n - 1 ) * P # Total width of all pins (center of last pin distance to center of first pin)
B1 = A1 + ( 1.95 * 2 ) # Width of bottom plate
LLatch = B1 - ( WL1 * 2 ) # Length of the latching plate
LPinTop = 7.7 + D1 # Length of the pin measured from the bottom plane to the top of the pin (away from PCB)
LPinBottom = 14.6 - LPinTop # Length of the pin in bottom direction, measured from the bottom plane
Pin1XOffset = ( ( n - 1 ) * P ) / 2 # First pin X offset measured from the X axis

# Compute asymmetric chamfer with constant angle triangle lengths
# Note: Top-facing angle of the chamfering triangle is [beta]
opposing_side = (Dlatch - Wx1) / 2 # Compute so that remaining part of latch is Wx1 wide
adjacent_side = opposing_side * (1/math.tan(math.radians(beta)))

# Start just outside the bottom plate
xstart = C1/2
xend = xstart + Dlatch
h1MinusChamfer = H1 - adjacent_side
latchPlate = (cq.Workplane("YZ")
    .sketch()
    # From bottom to start of chamfer
    .segment((xstart, 0), (xstart, h1MinusChamfer))
    # Chamfer edge
    .segment((xstart + opposing_side, H1))
    # Top side of latch (straight line) (up to begin of other side chamfer)
    .segment((xend - opposing_side, H1))
    # Chamfer edge
    .segment((xend, h1MinusChamfer))
    # move down to begin of latching surface
    .segment((xend, h1MinusChamfer - Hx1))
    # Move inwards (-X) for latching surface. NOTE: we assume 90° angle here
    # NOTE: D2 is the depth of the latching plate below the latching surface
    .segment((xstart + D2, h1MinusChamfer - Hx1))
    # From latching surface inside to bottom
    .segment((xstart + D2, 0))
    .close()
    .assemble(tag="face")
    .finalize()
    .extrude(1.0)
)
latchPlate
You are trying to construct a cq.Location object using code like
cq.Location(1, 2, 3)
however when you run it, you see the following error message:
File ~\AppData\Local\Packages\PythonSoftwareFoundation.Python.3.9_qbz5n2kfra8p0\LocalCache\local-packages\Python39\site-packages\cadquery\occ_impl\geom.py:1011, in Location.__init__(self, *args)
   1008 else:
   1009     t, ax, angle = args
   1010     T.SetRotation(
-> 1011         gp_Ax1(Vector().toPnt(), Vector(ax).toDir()), angle * math.pi / 180.0
   1012     )
   1013     T.SetTranslationPart(Vector(t).wrapped)
   1015 self.wrapped = TopLoc_Location(T)

File ~\AppData\Local\Packages\PythonSoftwareFoundation.Python.3.9_qbz5n2kfra8p0\LocalCache\local-packages\Python39\site-packages\cadquery\occ_impl\geom.py:91, in Vector.__init__(self, *args)
     89         fV = gp_Vec(args[0])
     90     else:
---> 91         raise TypeError("Expected three floats, OCC gp_, or 3-tuple")
     92 elif len(args) == 0:
     93     fV = gp_Vec(0, 0, 0)

TypeError: Expected three floats, OCC gp_, or 3-tupleDon’t pass three separate parameters to cq.Location() – pass a tuple with three numbers by adding an additional set of braces:
cq.Location((1, 2, 3))
import cadquery as cq

obj = cq.Workplane("XY").box(1,1,3)
# Add chamfer to only the top face edges parallel to the X axis
obj = obj.faces("+Z").edges("|X").chamfer(0.8, 0.3)
obj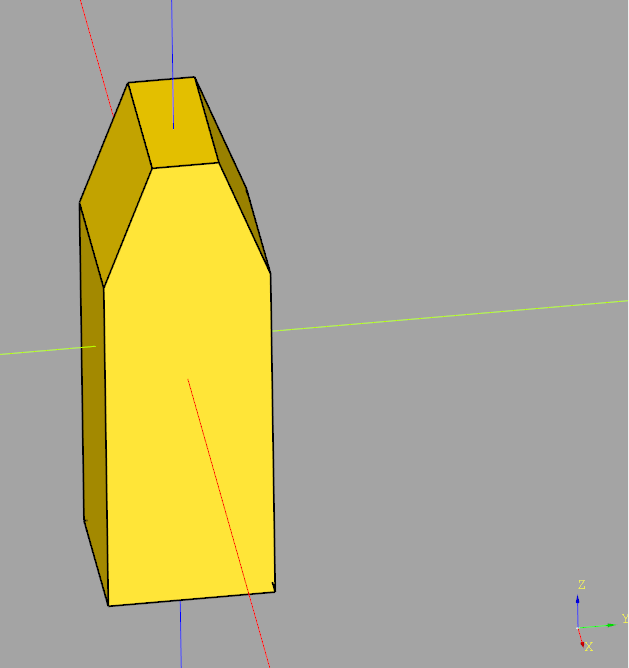
import cadquery as cq

obj = cq.Workplane("XY").box(1,1,3)
# Add chamfer to only the top face edges parallel to the X axis
obj = obj.faces("+Z").edges("|X").chamfer(0.2)
obj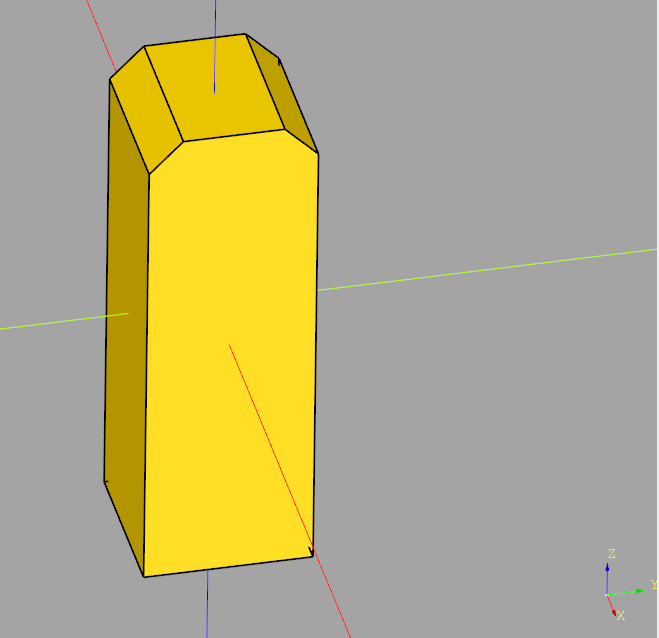
import cadquery as cq

obj = cq.Workplane("XY").box(1,1,3)
# Add chamfer to all top face edges
obj = obj.faces("+Z").chamfer(0.2)
obj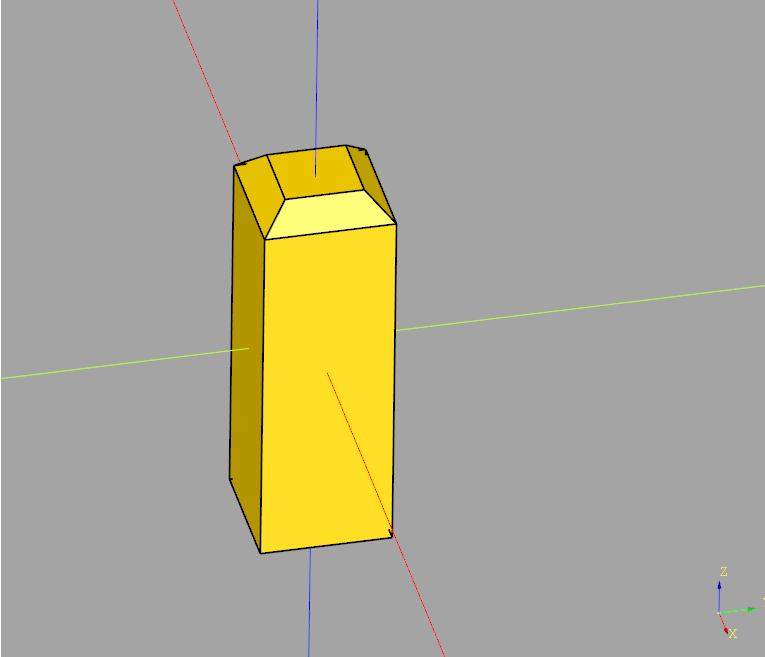
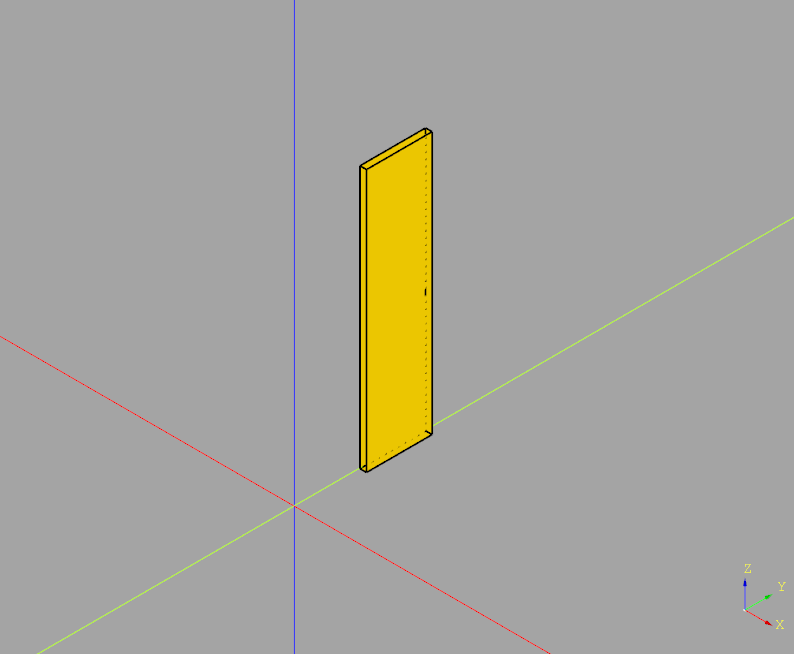
This code chamfers the top side of a sketch rectangle, which is then extruded
import cadquery as cq

obj = (cq.Workplane("YZ")
    .sketch()
    .rect(1,4)
    # Select vertices to chamfer
    .vertices(">Y") # Top of local Y coordinate system (which is Z axis)
    .chamfer(0.2)
    .finalize()
    .extrude(0.1)
)
obj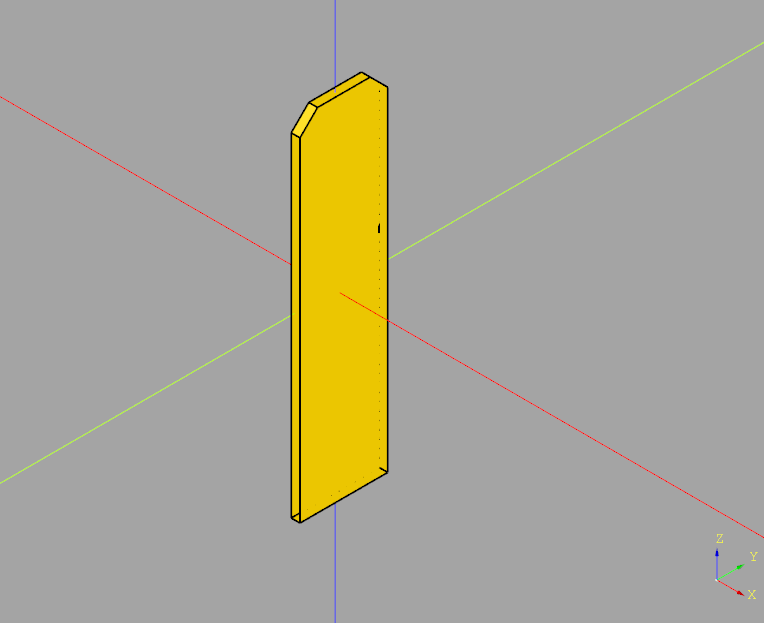
This code creates a sketch from four segment lines forming a rectangle (given the four sets of X/Y coordinates). The segments are then assembled into a face and extruded.
import cadquery as cq

xstart = 1.0
height = 4.0
width = 1.0
obj = (cq.Workplane("YZ")
    .sketch()
    .segment((xstart, 0), (xstart, height))
    .segment((xstart + width, height))
    .segment((xstart + width, 0))
    .close()
    .assemble(tag="face")
    .finalize()
    .extrude(0.1)
)
obj